Planetary Geology pdf - NASA
Planetary Geology pdf - NASA
Planetary Geology pdf - NASA

You also want an ePaper? Increase the reach of your titles
YUMPU automatically turns print PDFs into web optimized ePapers that Google loves.
Exercise<br />
Fifteen<br />
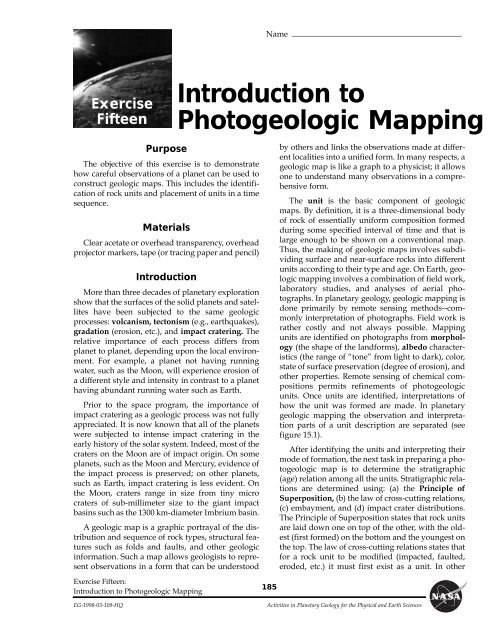
Purpose<br />
The objective of this exercise is to demonstrate<br />
how careful observations of a planet can be used to<br />
construct geologic maps. This includes the identification<br />
of rock units and placement of units in a time<br />
sequence.<br />
Materials<br />
Clear acetate or overhead transparency, overhead<br />
projector markers, tape (or tracing paper and pencil)<br />
Introduction<br />
More than three decades of planetary exploration<br />
show that the surfaces of the solid planets and satellites<br />
have been subjected to the same geologic<br />
processes: volcanism, tectonism (e.g., earthquakes),<br />
gradation (erosion, etc.), and impact cratering. The<br />
relative importance of each process differs from<br />
planet to planet, depending upon the local environment.<br />
For example, a planet not having running<br />
water, such as the Moon, will experience erosion of<br />
a different style and intensity in contrast to a planet<br />
having abundant running water such as Earth.<br />
Prior to the space program, the importance of<br />
impact cratering as a geologic process was not fully<br />
appreciated. It is now known that all of the planets<br />
were subjected to intense impact cratering in the<br />
early history of the solar system. Indeed, most of the<br />
craters on the Moon are of impact origin. On some<br />
planets, such as the Moon and Mercury, evidence of<br />
the impact process is preserved; on other planets,<br />
such as Earth, impact cratering is less evident. On<br />
the Moon, craters range in size from tiny micro<br />
craters of sub-millimeter size to the giant impact<br />
basins such as the 1300 km-diameter Imbrium basin.<br />
A geologic map is a graphic portrayal of the distribution<br />
and sequence of rock types, structural features<br />
such as folds and faults, and other geologic<br />
information. Such a map allows geologists to represent<br />
observations in a form that can be understood<br />
Exercise Fifteen:<br />
Introduction to Photogeologic Mapping<br />
Name<br />
Introduction to<br />
Photogeologic Mapping<br />
EG-1998-03-109-HQ Activities in <strong>Planetary</strong> <strong>Geology</strong> for the Physical and Earth Sciences<br />
185<br />
by others and links the observations made at different<br />
localities into a unified form. In many respects, a<br />
geologic map is like a graph to a physicist; it allows<br />
one to understand many observations in a comprehensive<br />
form.<br />
The unit is the basic component of geologic<br />
maps. By definition, it is a three-dimensional body<br />
of rock of essentially uniform composition formed<br />
during some specified interval of time and that is<br />
large enough to be shown on a conventional map.<br />
Thus, the making of geologic maps involves subdividing<br />
surface and near-surface rocks into different<br />
units according to their type and age. On Earth, geologic<br />
mapping involves a combination of field work,<br />
laboratory studies, and analyses of aerial photographs.<br />
In planetary geology, geologic mapping is<br />
done primarily by remote sensing methods--commonly<br />
interpretation of photographs. Field work is<br />
rather costly and not always possible. Mapping<br />
units are identified on photographs from morphology<br />
(the shape of the landforms), albedo characteristics<br />
(the range of ÒtoneÓ from light to dark), color,<br />
state of surface preservation (degree of erosion), and<br />
other properties. Remote sensing of chemical compositions<br />
permits refinements of photogeologic<br />
units. Once units are identified, interpretations of<br />
how the unit was formed are made. In planetary<br />
geologic mapping the observation and interpretation<br />
parts of a unit description are separated (see<br />
figure 15.1).<br />
After identifying the units and interpreting their<br />
mode of formation, the next task in preparing a photogeologic<br />
map is to determine the stratigraphic<br />
(age) relation among all the units. Stratigraphic relations<br />
are determined using: (a) the Principle of<br />
Superposition, (b) the law of cross-cutting relations,<br />
(c) embayment, and (d) impact crater distributions.<br />
The Principle of Superposition states that rock units<br />
are laid down one on top of the other, with the oldest<br />
(first formed) on the bottom and the youngest on<br />
the top. The law of cross-cutting relations states that<br />
for a rock unit to be modified (impacted, faulted,<br />
eroded, etc.) it must first exist as a unit. In other