Planetary Geology pdf - NASA
Planetary Geology pdf - NASA
Planetary Geology pdf - NASA

Create successful ePaper yourself
Turn your PDF publications into a flip-book with our unique Google optimized e-Paper software.
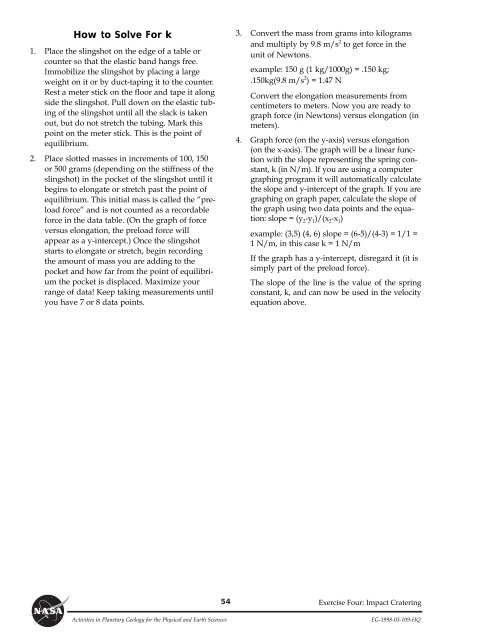
How to Solve For k<br />
1. Place the slingshot on the edge of a table or<br />
counter so that the elastic band hangs free.<br />
Immobilize the slingshot by placing a large<br />
weight on it or by duct-taping it to the counter.<br />
Rest a meter stick on the floor and tape it along<br />
side the slingshot. Pull down on the elastic tubing<br />
of the slingshot until all the slack is taken<br />
out, but do not stretch the tubing. Mark this<br />
point on the meter stick. This is the point of<br />
equilibrium.<br />
2. Place slotted masses in increments of 100, 150<br />
or 500 grams (depending on the stiffness of the<br />
slingshot) in the pocket of the slingshot until it<br />
begins to elongate or stretch past the point of<br />
equilibrium. This initial mass is called the Òpreload<br />
forceÓ and is not counted as a recordable<br />
force in the data table. (On the graph of force<br />
versus elongation, the preload force will<br />
appear as a y-intercept.) Once the slingshot<br />
starts to elongate or stretch, begin recording<br />
the amount of mass you are adding to the<br />
pocket and how far from the point of equilibrium<br />
the pocket is displaced. Maximize your<br />
range of data! Keep taking measurements until<br />
you have 7 or 8 data points.<br />
54<br />
3. Convert the mass from grams into kilograms<br />
and multiply by 9.8 m/s 2 to get force in the<br />
unit of Newtons.<br />
example: 150 g (1 kg/1000g) = .150 kg;<br />
.150kg(9.8 m/s 2 ) = 1.47 N<br />
Convert the elongation measurements from<br />
centimeters to meters. Now you are ready to<br />
graph force (in Newtons) versus elongation (in<br />
meters).<br />
4. Graph force (on the y-axis) versus elongation<br />
(on the x-axis). The graph will be a linear function<br />
with the slope representing the spring constant,<br />
k (in N/m). If you are using a computer<br />
graphing program it will automatically calculate<br />
the slope and y-intercept of the graph. If you are<br />
graphing on graph paper, calculate the slope of<br />
the graph using two data points and the equation:<br />
slope = (y 2-y 1)/(x 2-x 1)<br />
example: (3,5) (4, 6) slope = (6-5)/(4-3) = 1/1 =<br />
1 N/m, in this case k = 1 N/m<br />
If the graph has a y-intercept, disregard it (it is<br />
simply part of the preload force).<br />
The slope of the line is the value of the spring<br />
constant, k, and can now be used in the velocity<br />
equation above.<br />
Exercise Four: Impact Cratering<br />
Activities in <strong>Planetary</strong> <strong>Geology</strong> for the Physical and Earth Sciences EG-1998-03-109-HQ