Planetary Geology pdf - NASA
Planetary Geology pdf - NASA
Planetary Geology pdf - NASA

You also want an ePaper? Increase the reach of your titles
YUMPU automatically turns print PDFs into web optimized ePapers that Google loves.
Once the stratigraphic relations have been determined,<br />
the units are listed on the map in order from<br />
oldest (at the bottom) to youngest (at the top). This<br />
is called the stratigraphic column. The final task,<br />
and the primary objective in preparing the photogeologic<br />
map, is to derive a general geologic history<br />
of the region being mapped. The geologic history<br />
synthesizes the events that formed the surface<br />
seen in the photoÑincluding interpretation of the<br />
processes in the formation of rock units and events<br />
that have modified the unitsÑand is presented in<br />
chronological order from oldest to youngest.<br />
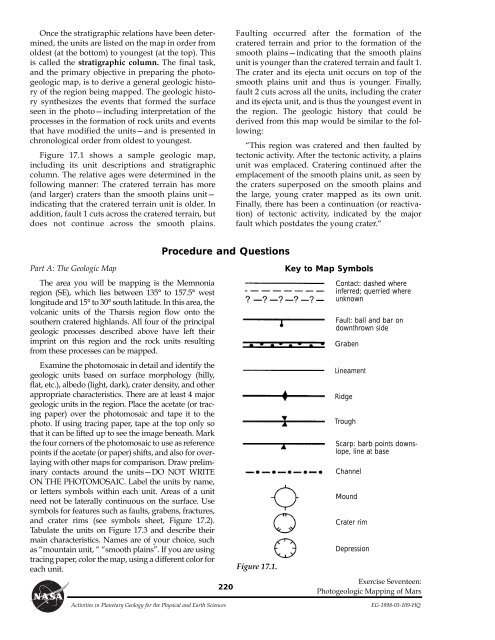
Figure 17.1 shows a sample geologic map,<br />
including its unit descriptions and stratigraphic<br />
column. The relative ages were determined in the<br />
following manner: The cratered terrain has more<br />
(and larger) craters than the smooth plains unitÑ<br />
indicating that the cratered terrain unit is older. In<br />
addition, fault 1 cuts across the cratered terrain, but<br />
does not continue across the smooth plains.<br />
Part A: The Geologic Map<br />
The area you will be mapping is the Memnonia<br />
region (SE), which lies between 135¡ to 157.5¡ west<br />
longitude and 15¡ to 30¡ south latitude. In this area, the<br />
volcanic units of the Tharsis region flow onto the<br />
southern cratered highlands. All four of the principal<br />
geologic processes described above have left their<br />
imprint on this region and the rock units resulting<br />
from these processes can be mapped.<br />
Examine the photomosaic in detail and identify the<br />
geologic units based on surface morphology (hilly,<br />
flat, etc.), albedo (light, dark), crater density, and other<br />
appropriate characteristics. There are at least 4 major<br />
geologic units in the region. Place the acetate (or tracing<br />
paper) over the photomosaic and tape it to the<br />
photo. If using tracing paper, tape at the top only so<br />
that it can be lifted up to see the image beneath. Mark<br />
the four corners of the photomosaic to use as reference<br />
points if the acetate (or paper) shifts, and also for overlaying<br />
with other maps for comparison. Draw preliminary<br />
contacts around the unitsÑDO NOT WRITE<br />
ON THE PHOTOMOSAIC. Label the units by name,<br />
or letters symbols within each unit. Areas of a unit<br />
need not be laterally continuous on the surface. Use<br />
symbols for features such as faults, grabens, fractures,<br />
and crater rims (see symbols sheet, Figure 17.2).<br />
Tabulate the units on Figure 17.3 and describe their<br />
main characteristics. Names are of your choice, such<br />
as Òmountain unit, Ò Òsmooth plainsÓ. If you are using<br />
tracing paper, color the map, using a different color for<br />
each unit.<br />
Procedure and Questions<br />
220<br />
Faulting occurred after the formation of the<br />
cratered terrain and prior to the formation of the<br />
smooth plainsÑindicating that the smooth plains<br />
unit is younger than the cratered terrain and fault 1.<br />
The crater and its ejecta unit occurs on top of the<br />
smooth plains unit and thus is younger. Finally,<br />
fault 2 cuts across all the units, including the crater<br />
and its ejecta unit, and is thus the youngest event in<br />
the region. The geologic history that could be<br />
derived from this map would be similar to the following:<br />
ÒThis region was cratered and then faulted by<br />
tectonic activity. After the tectonic activity, a plains<br />
unit was emplaced. Cratering continued after the<br />
emplacement of the smooth plains unit, as seen by<br />
the craters superposed on the smooth plains and<br />
the large, young crater mapped as its own unit.<br />
Finally, there has been a continuation (or reactivation)<br />
of tectonic activity, indicated by the major<br />
fault which postdates the young crater.Ò<br />
Figure 17.1.<br />
Key to Map Symbols<br />
Contact: dashed where<br />
inferred; querried where<br />
unknown<br />
Fault: ball and bar on<br />
downthrown side<br />
Graben<br />
Lineament<br />
Exercise Seventeen:<br />
Photogeologic Mapping of Mars<br />
Activities in <strong>Planetary</strong> <strong>Geology</strong> for the Physical and Earth Sciences EG-1998-03-109-HQ<br />
Ridge<br />
Trough<br />
Scarp: barb points downslope,<br />
line at base<br />
Channel<br />
Mound<br />
Crater rim<br />
Depression