

CEPAL Review no. 124
April 2018
April 2018

Create successful ePaper yourself
Turn your PDF publications into a flip-book with our unique Google optimized e-Paper software.
104 <strong>CEPAL</strong> <strong>Review</strong> N° <strong>124</strong> • April 2018<br />
• The production of minerals, measured in terms of refined units equivalent, associated with the<br />
deposits or mines located in the country.<br />
• The price observed on the international minerals market, for the purpose of estimating sales<br />
value, which generally differs from the amount reported by the companies themselves.<br />
• The total costs of mining production in deposits or mines, including the opportunity cost of capital<br />
(Brandt, Schreyer and Zipperer, 2013).<br />
In the case of Chile, this study considers the following mining products in addition to copper: tin,<br />
gold, lead, zinc, iron, nickel, silver, bauxite and phosphate. Copper rents are predominant —accounting<br />
for over 95%— compared to the rents associated with other minerals, especially in 2005-2014 (Brandt,<br />
Schreyer and Zipperer, 2013). Moreover, most of the minerals considered are themselves by-products<br />
of the large-scale copper mining industry and are therefore present, although to a lesser extent, in<br />
these firms’ revenues. It should be <strong>no</strong>ted that the contribution made by these minerals to the calculated<br />
rents is underestimated, since the by-products of the large private copper mining sector have been<br />
systematically under-reported owing to the lack of measurements by laboratories that are genuinely<br />
independent of the mining companies (Castillo, 2015).<br />
It should be <strong>no</strong>ted that the rents measured by the World Bank do <strong>no</strong>t correspond to eco<strong>no</strong>mic rents<br />
strictly defined —as used in this study— since they do <strong>no</strong>t deduct the returns needed to compensate<br />
for exploration expenditure risks and the volatility of international mineral prices. These two issues are<br />
addressed in this study and the corresponding calculations are made.<br />
2. Mining rents in Chile compared to those<br />
of other copper-producing countries<br />
In 2014, 31% of all copper produced in the world was mined in Chile, as shown in figure 1 which reports<br />
the global production shares of the 10 countries that extracted the largest amount of copper in that year.<br />
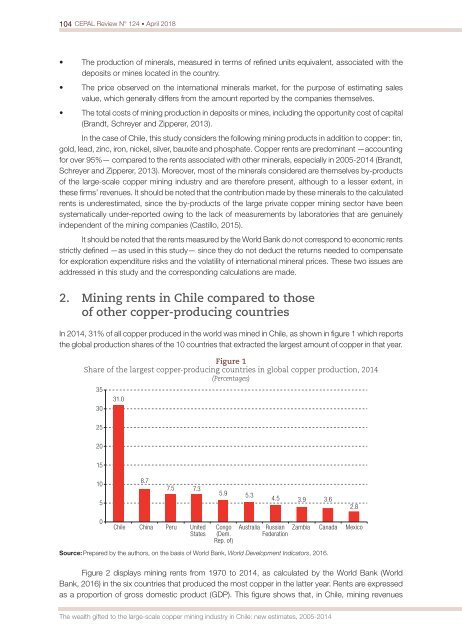
Figure 1<br />
Share of the largest copper-producing countries in global copper production, 2014<br />
(Percentages)<br />
35<br />
30<br />
25<br />
31.0<br />
20<br />
15<br />
10<br />
5<br />
8.7<br />
7.5 7.3<br />
5.9 5.3<br />
4.5 3.9 3.6<br />
2.8<br />
0<br />
Chile China Peru United<br />
States<br />
Congo<br />
(Dem.<br />
Rep. of)<br />
Australia Russian<br />
Federation<br />
Zambia Canada Mexico<br />
Source: Prepared by the authors, on the basis of World Bank, World Development Indicators, 2016.<br />
Figure 2 displays mining rents from 1970 to 2014, as calculated by the World Bank (World<br />
Bank, 2016) in the six countries that produced the most copper in the latter year. Rents are expressed<br />
as a proportion of gross domestic product (GDP). This figure shows that, in Chile, mining revenues<br />
The wealth gifted to the large-scale copper mining industry in Chile: new estimates, 2005-2014


