

CEPAL Review no. 124
April 2018
April 2018

Create successful ePaper yourself
Turn your PDF publications into a flip-book with our unique Google optimized e-Paper software.
210 <strong>CEPAL</strong> <strong>Review</strong> N° <strong>124</strong> • April 2018<br />
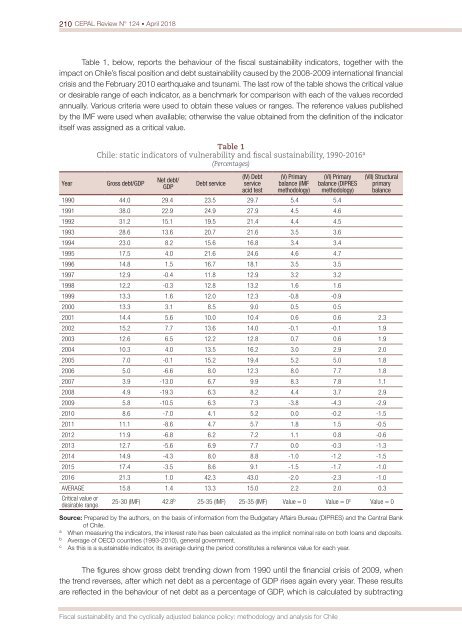
Table 1, below, reports the behaviour of the fiscal sustainability indicators, together with the<br />
impact on Chile’s fiscal position and debt sustainability caused by the 2008-2009 international financial<br />
crisis and the February 2010 earthquake and tsunami. The last row of the table shows the critical value<br />
or desirable range of each indicator, as a benchmark for comparison with each of the values recorded<br />
annually. Various criteria were used to obtain these values or ranges. The reference values published<br />
by the IMF were used when available; otherwise the value obtained from the definition of the indicator<br />
itself was assigned as a critical value.<br />
Year<br />
Table 1<br />
Chile: static indicators of vulnerability and fiscal sustainability, 1990-2016 a<br />
(Percentages)<br />
Gross debt/GDP<br />
Net debt/<br />
GDP<br />
Debt service<br />
(IV) Debt<br />
service<br />
acid test<br />
(V) Primary<br />
balance (IMF<br />
methodology)<br />
(VI) Primary<br />
balance (DIPRES<br />
methodology)<br />
1990 44.0 29.4 23.5 29.7 5.4 5.4<br />
1991 38.0 22.9 24.9 27.9 4.5 4.6<br />
1992 31.2 15.1 19.5 21.4 4.4 4.5<br />
1993 28.6 13.6 20.7 21.6 3.5 3.6<br />
1994 23.0 8.2 15.6 16.8 3.4 3.4<br />
1995 17.5 4.0 21.6 24.6 4.6 4.7<br />
1996 14.8 1.5 16.7 18.1 3.5 3.5<br />
1997 12.9 -0.4 11.8 12.9 3.2 3.2<br />
1998 12.2 -0.3 12.8 13.2 1.6 1.6<br />
1999 13.3 1.6 12.0 12.3 -0.8 -0.9<br />
2000 13.3 3.1 8.5 9.0 0.5 0.5<br />
(VII) Structural<br />
primary<br />
balance<br />
2001 14.4 5.6 10.0 10.4 0.6 0.6 2.3<br />
2002 15.2 7.7 13.6 14.0 -0.1 -0.1 1.9<br />
2003 12.6 6.5 12.2 12.8 0.7 0.6 1.9<br />
2004 10.3 4.0 13.5 16.2 3.0 2.9 2.0<br />
2005 7.0 -0.1 15.2 19.4 5.2 5.0 1.8<br />
2006 5.0 -6.6 8.0 12.3 8.0 7.7 1.8<br />
2007 3.9 -13.0 6.7 9.9 8.3 7.8 1.1<br />
2008 4.9 -19.3 6.3 8.2 4.4 3.7 2.9<br />
2009 5.8 -10.5 6.3 7.3 -3.8 -4.3 -2.9<br />
2010 8.6 -7.0 4.1 5.2 0.0 -0.2 -1.5<br />
2011 11.1 -8.6 4.7 5.7 1.8 1.5 -0.5<br />
2012 11.9 -6.8 6.2 7.2 1.1 0.8 -0.6<br />
2013 12.7 -5.6 6.9 7.7 0.0 -0.3 -1.3<br />
2014 14.9 -4.3 8.0 8.8 -1.0 -1.2 -1.5<br />
2015 17.4 -3.5 8.6 9.1 -1.5 -1.7 -1.0<br />
2016 21.3 1.0 42.3 43.0 -2.0 -2.3 -1.0<br />
AVERAGE 15.8 1.4 13.3 15.0 2.2 2.0 0.3<br />
Critical value or<br />
desirable range<br />
25-30 (IMF) 42.8 b 25-35 (IMF) 25-35 (IMF) Value = 0 Value = 0 c Value = 0<br />
Source: Prepared by the authors, on the basis of information from the Budgetary Affairs Bureau (DIPRES) and the Central Bank<br />
of Chile.<br />
a<br />
When measuring the indicators, the interest rate has been calculated as the implicit <strong>no</strong>minal rate on both loans and deposits.<br />
b<br />
Average of OECD countries (1993-2010), general government.<br />
c<br />
As this is a sustainable indicator, its average during the period constitutes a reference value for each year.<br />
The figures show gross debt trending down from 1990 until the financial crisis of 2009, when<br />
the trend reverses, after which net debt as a percentage of GDP rises again every year. These results<br />
are reflected in the behaviour of net debt as a percentage of GDP, which is calculated by subtracting<br />
Fiscal sustainability and the cyclically adjusted balance policy: methodology and analysis for Chile


