

CEPAL Review no. 124
April 2018
April 2018

Create successful ePaper yourself
Turn your PDF publications into a flip-book with our unique Google optimized e-Paper software.
40 <strong>CEPAL</strong> <strong>Review</strong> N° <strong>124</strong> • April 2018<br />
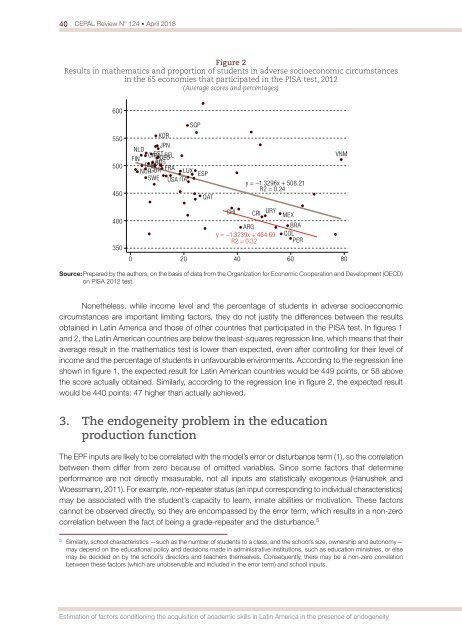
Figure 2<br />
Results in mathematics and proportion of students in adverse socioeco<strong>no</strong>mic circumstances<br />
in the 65 eco<strong>no</strong>mies that participated in the PISA test, 2012<br />
(Average scores and percentages)<br />
600<br />
SGP<br />
550<br />
500<br />
450<br />
KOR<br />
JPN<br />
NLD<br />
CAN ESTBEL<br />
FIN DEU<br />
DNK AUT AUS<br />
NORGBR<br />
FRA<br />
LUX<br />
SWE USA ITA<br />
ESP<br />
QAT<br />
y = −1.3296x + 508.21<br />
R2 = 0.24<br />
VNM<br />
400<br />
350<br />
CHL<br />
CRI<br />
URY<br />
ARG<br />
y = −1.3239x + 464.69<br />
R2 = 0.32<br />
MEX<br />
BRA<br />
COL<br />
PER<br />
0 20 40 60 80<br />
Source: Prepared by the authors, on the basis of data from the Organization for Eco<strong>no</strong>mic Cooperation and Development (OECD)<br />
on PISA 2012 test.<br />
Nonetheless, while income level and the percentage of students in adverse socioeco<strong>no</strong>mic<br />
circumstances are important limiting factors, they do <strong>no</strong>t justify the differences between the results<br />
obtained in Latin America and those of other countries that participated in the PISA test. In figures 1<br />
and 2, the Latin American countries are below the least-squares regression line, which means that their<br />
average result in the mathematics test is lower than expected, even after controlling for their level of<br />
income and the percentage of students in unfavourable environments. According to the regression line<br />
shown in figure 1, the expected result for Latin American countries would be 449 points, or 58 above<br />
the score actually obtained. Similarly, according to the regression line in figure 2, the expected result<br />
would be 440 points: 47 higher than actually achieved.<br />
3. The endogeneity problem in the education<br />
production function<br />
The EPF inputs are likely to be correlated with the model’s error or disturbance term (1), so the correlation<br />
between them differ from zero because of omitted variables. Since some factors that determine<br />
performance are <strong>no</strong>t directly measurable, <strong>no</strong>t all inputs are statistically exoge<strong>no</strong>us (Hanushek and<br />
Woessmann, 2011). For example, <strong>no</strong>n-repeater status (an input corresponding to individual characteristics)<br />
may be associated with the student’s capacity to learn, innate abilities or motivation. These factors<br />
can<strong>no</strong>t be observed directly, so they are encompassed by the error term, which results in a <strong>no</strong>n-zero<br />
correlation between the fact of being a grade-repeater and the disturbance. 5<br />
5<br />
Similarly, school characteristics —such as the number of students to a class, and the school’s size, ownership and auto<strong>no</strong>my—<br />
may depend on the educational policy and decisions made in administrative institutions, such as education ministries, or else<br />
may be decided on by the school’s directors and teachers themselves. Consequently, there may be a <strong>no</strong>n-zero correlation<br />
between these factors (which are u<strong>no</strong>bservable and included in the error term) and school inputs.<br />
Estimation of factors conditioning the acquisition of academic skills in Latin America in the presence of endogeneity


