

CEPAL Review no. 124
April 2018
April 2018

You also want an ePaper? Increase the reach of your titles
YUMPU automatically turns print PDFs into web optimized ePapers that Google loves.
38 <strong>CEPAL</strong> <strong>Review</strong> N° <strong>124</strong> • April 2018<br />
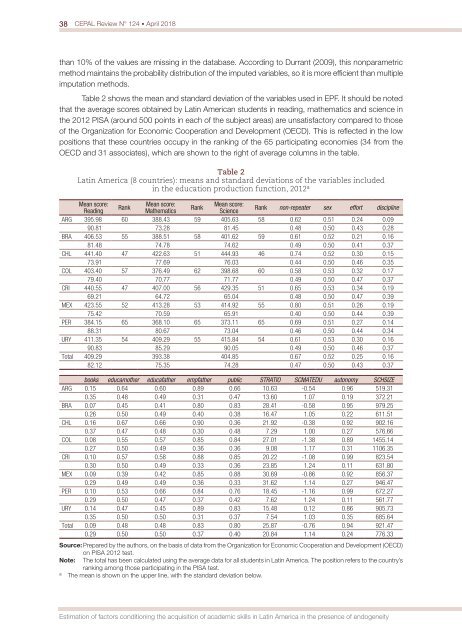
than 10% of the values are missing in the database. According to Durrant (2009), this <strong>no</strong>nparametric<br />
method maintains the probability distribution of the imputed variables, so it is more efficient than multiple<br />
imputation methods.<br />
Table 2 shows the mean and standard deviation of the variables used in EPF. It should be <strong>no</strong>ted<br />
that the average scores obtained by Latin American students in reading, mathematics and science in<br />
the 2012 PISA (around 500 points in each of the subject areas) are unsatisfactory compared to those<br />
of the Organization for Eco<strong>no</strong>mic Cooperation and Development (OECD). This is reflected in the low<br />
positions that these countries occupy in the ranking of the 65 participating eco<strong>no</strong>mies (34 from the<br />
OECD and 31 associates), which are shown to the right of average columns in the table.<br />
Table 2<br />
Latin America (8 countries): means and standard deviations of the variables included<br />
in the education production function, 2012 a<br />
Mean score:<br />
Reading<br />
Rank<br />
Mean score:<br />
Mathematics<br />
Rank<br />
Mean score:<br />
Science<br />
Rank <strong>no</strong>n-repeater sex effort discipline<br />
ARG 395.98 60 388.43 59 405.63 58 0.62 0.51 0.24 0.09<br />
90.81 73.28 81.45 0.48 0.50 0.43 0.28<br />
BRA 406.53 55 388.51 58 401.62 59 0.61 0.52 0.21 0.16<br />
81.48 74.78 74.62 0.49 0.50 0.41 0.37<br />
CHL 441.40 47 422.63 51 444.93 46 0.74 0.52 0.30 0.15<br />
73.91 77.69 76.03 0.44 0.50 0.46 0.35<br />
COL 403.40 57 376.49 62 398.68 60 0.58 0.53 0.32 0.17<br />
79.40 70.77 71.77 0.49 0.50 0.47 0.37<br />
CRI 440.55 47 407.00 56 429.35 51 0.65 0.53 0.34 0.19<br />
69.21 64.72 65.04 0.48 0.50 0.47 0.39<br />
MEX 423.55 52 413.28 53 414.92 55 0.80 0.51 0.26 0.19<br />
75.42 70.59 65.91 0.40 0.50 0.44 0.39<br />
PER 384.15 65 368.10 65 373.11 65 0.69 0.51 0.27 0.14<br />
88.31 80.67 73.04 0.46 0.50 0.44 0.34<br />
URY 411.35 54 409.29 55 415.84 54 0.61 0.53 0.30 0.16<br />
90.83 85.29 90.05 0.49 0.50 0.46 0.37<br />
Total 409.29 393.38 404.85 0.67 0.52 0.25 0.16<br />
82.12 75.35 74.28 0.47 0.50 0.43 0.37<br />
books educamother educafather empfather public STRATIO SCMATEDU auto<strong>no</strong>my SCHSIZE<br />
ARG 0.15 0.64 0.60 0.89 0.66 10.63 -0.54 0.96 519.31<br />
0.35 0.48 0.49 0.31 0.47 13.60 1.07 0.19 372.21<br />
BRA 0.07 0.45 0.41 0.80 0.83 28.41 -0.58 0.95 979.25<br />
0.26 0.50 0.49 0.40 0.38 16.47 1.05 0.22 611.51<br />
CHL 0.16 0.67 0.66 0.90 0.36 21.92 -0.38 0.92 902.16<br />
0.37 0.47 0.48 0.30 0.48 7.29 1.00 0.27 576.66<br />
COL 0.08 0.55 0.57 0.85 0.84 27.01 -1.38 0.89 1455.14<br />
0.27 0.50 0.49 0.36 0.36 9.08 1.17 0.31 1106.35<br />
CRI 0.10 0.57 0.58 0.88 0.85 20.22 -1.08 0.99 823.54<br />
0.30 0.50 0.49 0.33 0.36 23.85 1.24 0.11 631.80<br />
MEX 0.09 0.39 0.42 0.85 0.88 30.69 -0.86 0.92 856.37<br />
0.29 0.49 0.49 0.36 0.33 31.62 1.14 0.27 946.47<br />
PER 0.10 0.53 0.66 0.84 0.76 18.45 -1.16 0.99 672.27<br />
0.29 0.50 0.47 0.37 0.42 7.62 1.24 0.11 561.77<br />
URY 0.14 0.47 0.45 0.89 0.83 15.48 0.12 0.86 905.73<br />
0.35 0.50 0.50 0.31 0.37 7.54 1.03 0.35 685.64<br />
Total 0.09 0.48 0.48 0.83 0.80 25.87 -0.76 0.94 921.47<br />
0.29 0.50 0.50 0.37 0.40 20.84 1.14 0.24 776.33<br />
Source: Prepared by the authors, on the basis of data from the Organization for Eco<strong>no</strong>mic Cooperation and Development (OECD)<br />
on PISA 2012 test.<br />
Note: The total has been calculated using the average data for all students in Latin America. The position refers to the country’s<br />
ranking among those participating in the PISA test.<br />
a<br />
The mean is shown on the upper line, with the standard deviation below.<br />
Estimation of factors conditioning the acquisition of academic skills in Latin America in the presence of endogeneity


