

CEPAL Review no. 124
April 2018
April 2018

You also want an ePaper? Increase the reach of your titles
YUMPU automatically turns print PDFs into web optimized ePapers that Google loves.
12 <strong>CEPAL</strong> <strong>Review</strong> N° <strong>124</strong> • April 2018<br />
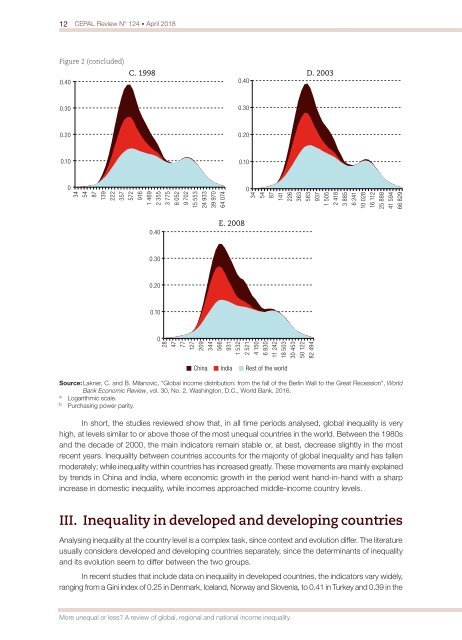
Figure 2 (concluded)<br />
C. 1998 D. 2003<br />
0.40<br />
0.40<br />
0.30<br />
0.30<br />
0.20<br />
0.20<br />
0.10<br />
0.10<br />
0<br />
34<br />
54<br />
87<br />
139<br />
222<br />
357<br />
572<br />
916<br />
1 469<br />
2 355<br />
3 775<br />
6 052<br />
9 702<br />
15 553<br />
24 933<br />
39 970<br />
64 074<br />
0<br />
34<br />
54<br />
87<br />
141<br />
226<br />
363<br />
583<br />
937<br />
1 505<br />
2 418<br />
3 885<br />
6 241<br />
10 028<br />
16 112<br />
25 888<br />
41 594<br />
66 829<br />
0.40<br />
E. 2008<br />
0.30<br />
0.20<br />
0.10<br />
0<br />
28<br />
47<br />
77<br />
127<br />
209<br />
344<br />
566<br />
931<br />
1 532<br />
2 521<br />
4 150<br />
6 830<br />
11 242<br />
18 503<br />
30 453<br />
50 122<br />
82 494<br />
China India Rest of the world<br />
Source: Lakner, C. and B. Mila<strong>no</strong>vic, “Global income distribution: from the fall of the Berlin Wall to the Great Recession”, World<br />
Bank Eco<strong>no</strong>mic <strong>Review</strong>, vol. 30, No. 2, Washington, D.C., World Bank, 2016.<br />
a<br />
Logarithmic scale.<br />
b<br />
Purchasing power parity.<br />
In short, the studies reviewed show that, in all time periods analysed, global inequality is very<br />
high, at levels similar to or above those of the most unequal countries in the world. Between the 1980s<br />
and the decade of 2000, the main indicators remain stable or, at best, decrease slightly in the most<br />
recent years. Inequality between countries accounts for the majority of global inequality and has fallen<br />
moderately; while inequality within countries has increased greatly. These movements are mainly explained<br />
by trends in China and India, where eco<strong>no</strong>mic growth in the period went hand-in-hand with a sharp<br />
increase in domestic inequality, while incomes approached middle-income country levels.<br />
III. Inequality in developed and developing countries<br />
Analysing inequality at the country level is a complex task, since context and evolution differ. The literature<br />
usually considers developed and developing countries separately, since the determinants of inequality<br />
and its evolution seem to differ between the two groups.<br />
In recent studies that include data on inequality in developed countries, the indicators vary widely,<br />
ranging from a Gini index of 0.25 in Denmark, Iceland, Norway and Slovenia, to 0.41 in Turkey and 0.39 in the<br />
More unequal or less? A review of global, regional and national income inequality


