

CEPAL Review no. 124
April 2018
April 2018

Create successful ePaper yourself
Turn your PDF publications into a flip-book with our unique Google optimized e-Paper software.
130 <strong>CEPAL</strong> <strong>Review</strong> N° <strong>124</strong> • April 2018<br />
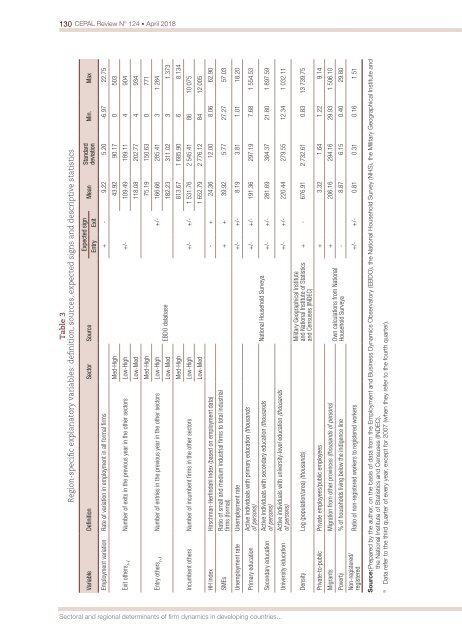
Table 3<br />
Region-specific explanatory variables: definition, sources, expected signs and descriptive statistics<br />
Variable Definition Sector Source<br />
Employment variation Rate of variation in employment in all formal firms<br />
Exit others t-1<br />
Number of exits in the previous year in the other sectors<br />
Entry others t-1<br />
Number of entries in the previous year in the other sectors<br />
Incumbent others Number of incumbent firms in the other sectors<br />
Med-High<br />
Expected sign<br />
Entry Exit<br />
Mean<br />
Standard<br />
deviation<br />
Min. Max<br />
+ - 9.22 5.20 -6.97 22.75<br />
43.92 90.17 0 503<br />
Low-Med 118.08 202.77 4 934<br />
Med-High<br />
75.19 150.63 0 771<br />
Low-High +/-<br />
109.49 189.11 4 904<br />
Low-High +/- 166.66 285.41 3 1 284<br />
Low-Med EBDO database<br />
182.23 311.02 3 1.373<br />
Med-High<br />
813.67 1 685.90 6 8.134<br />
Low-High +/- +/- 1 531.76 2 545.41 86 10 075<br />
Low-Med 1 652.79 2 776.12 84 12 005<br />
HH index Hirschman-Herfindahl Index (based on employment data) - + 24.36 12.00 8.06 62.90<br />
SMEs<br />
Unemployment rate Unemployment rate<br />
Primary education<br />
Secondary education<br />
University education<br />
Ratio of small and medium industrial firms to total industrial<br />
firms (formal)<br />
Active individuals with primary education (thousands<br />
of persons)<br />
Active individuals with secondary education (thousands<br />
of persons)<br />
Active individuals with university-level education (thousands<br />
of persons)<br />
Density Log (population/area) (thousands)<br />
Private-to-public Private employees/public employees<br />
National Household Surveya<br />
Military Geographical Institute<br />
and National Institute of Statistics<br />
and Censuses (INDEC)<br />
+ + 39.92 5.77 27.27 57.03<br />
+/- +/- 8.19 3.81 1.01 18.20<br />
+/- +/- 191.36 297.19 7.68 1 554.53<br />
+/- +/- 281.69 384.37 21.80 1 897.59<br />
+/- +/- 220.44 279.55 12.34 1 032.11<br />
+ - 676.91 2 732.61 0.83 13 739.75<br />
+ 3.32 1.64 1.22 9.14<br />
Migrants Migration from other provinces (thousands of persons) Own calculations from National<br />
+ 206.16 294.16 29.93 1 506.10<br />
Poverty % of households living below the indigence line Household Surveya<br />
- 8.87 6.15 0.40 29.80<br />
Non-registered/<br />
registered<br />
Ratio of <strong>no</strong>n-registered workers to registered workers +/- +/- 0.81 0.31 0.16 1.51<br />
Source: Prepared by the author, on the basis of data from the Employment and Business Dynamics Observatory (EBDO), the National Household Survey (NHS), the Military Geographical Institute and<br />
the National Institute of Statistics and Censuses (INDEC).<br />
a<br />
Data refer to the third quarter of every year, except for 2007 (when they refer to the fourth quarter).<br />
Sectoral and regional determinants of firm dynamics in developing countries...


