CEPAL Review no. 124
April 2018
April 2018
You also want an ePaper? Increase the reach of your titles
YUMPU automatically turns print PDFs into web optimized ePapers that Google loves.
148 <strong>CEPAL</strong> <strong>Review</strong> N° <strong>124</strong> • April 2018<br />
expectations, since eco<strong>no</strong>mic agents correct their expectations on the basis of past forecasting errors.<br />
In other words, expected inflation, p t e , would be modelled as a weighted-average of past inflation rates,<br />
with heavier weights attaching to more recent data. The Phillips curve would thus assume the form:<br />
p t<br />
= j p t<br />
e<br />
+ g (u t<br />
– u n<br />
)+ e t<br />
(2)<br />
where p t<br />
is current inflation, and p t<br />
e<br />
is expected inflation in period t, formulated as a weighted-average<br />
of past inflation rates, u t<br />
is the current unemployment rate and u n<br />
the natural rate.<br />
This gave agents’ expectations a fundamental role in the construction and execution of eco<strong>no</strong>mic<br />
policies. Nonetheless, it was subsequently realized that adaptive expectations would lead eco<strong>no</strong>mic<br />
agents to commit systematic forecasting errors, which is <strong>no</strong>t realistically sustainable.<br />
This finding triggered a revolution in macroeco<strong>no</strong>mic theory between the 1970s and 1980s, driven<br />
by the forward-looking rational expectations hypothesis, attributed to Lucas (1972) and Sargent (1971).<br />
According to these authors, eco<strong>no</strong>mic agents predict future inflation by considering all of the information<br />
available to them up to the current period, and <strong>no</strong>t just a combination of past data. Thus, expectations<br />
become a function of the set of all data available up to t, so the Phillips curve also needs a forwardlooking<br />
component.<br />
2. New-Keynesian Phillips Curve<br />
A new approach to the Phillips curve has been widely discussed in recent decades. Taylor (1980)<br />
and Calvo (1983) laid the foundations for the modern analysis of inflation by examining price and<br />
wage choices from the perspective of forward-looking families and businesses. In this version, the<br />
curve is deduced as a relation between inflation and firms’ marginal cost. This formulation, called the<br />
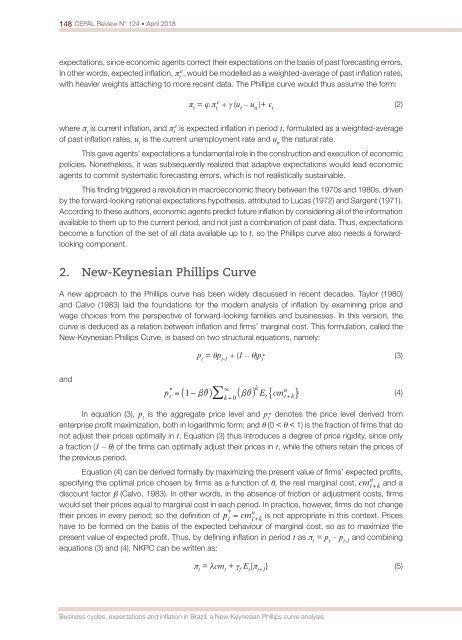
New-Keynesian Phillips Curve, is based on two structural equations, namely:<br />
p t<br />
= qp t-1<br />
+ (1 – q)p t<br />
* (3)<br />
and<br />
(4)<br />
In equation (3), p t<br />
is the aggregate price level and p t<br />
* de<strong>no</strong>tes the price level derived from<br />
enterprise profit maximization, both in logarithmic form; and q (0 < q < 1) is the fraction of firms that do<br />
<strong>no</strong>t adjust their prices optimally in t. Equation (3) thus introduces a degree of price rigidity, since only<br />
a fraction (1 – q) of the firms can optimally adjust their prices in t, while the others retain the prices of<br />
the previous period.<br />
Equation (4) can be derived formally by maximizing the present value of firms’ expected profits,<br />
specifying the optimal price chosen by firms as a function of q, the real marginal cost, and a<br />
discount factor b (Calvo, 1983). In other words, in the absence of friction or adjustment costs, firms<br />
would set their prices equal to marginal cost in each period. In practice, however, firms do <strong>no</strong>t change<br />
their prices in every period; so the definition of<br />
is <strong>no</strong>t appropriate in this context. Prices<br />
have to be formed on the basis of the expected behaviour of marginal cost, so as to maximize the<br />
present value of expected profit. Thus, by defining inflation in period t as p t<br />
= p t<br />
– p t-1<br />
and combining<br />
equations (3) and (4), NKPC can be written as:<br />
p t<br />
= lcm t<br />
+ g f<br />
E t<br />
{p t+1<br />
} (5)<br />
Business cycles, expectations and inflation in Brazil: a New-Keynesian Phillips curve analysis


