

CEPAL Review no. 124
April 2018
April 2018

Create successful ePaper yourself
Turn your PDF publications into a flip-book with our unique Google optimized e-Paper software.
164 <strong>CEPAL</strong> <strong>Review</strong> N° <strong>124</strong> • April 2018<br />
14<br />
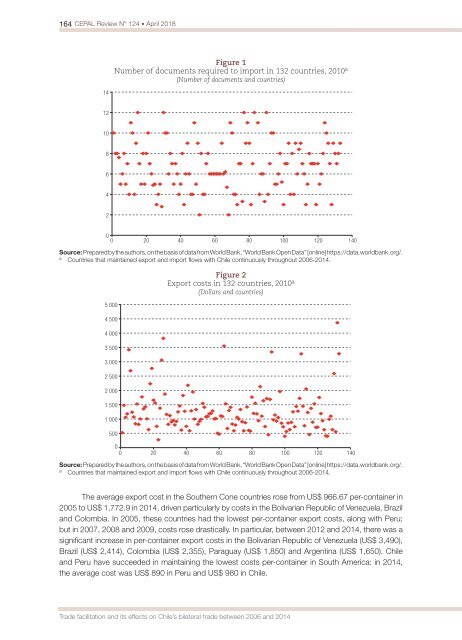
Figure 1<br />
Number of documents required to import in 132 countries, 2010 a<br />
(Number of documents and countries)<br />
12<br />
10<br />
8<br />
6<br />
4<br />
2<br />
0<br />
0 20 40 60 80 100 120 140<br />
Source: Prepared by the authors, on the basis of data from World Bank, “World Bank Open Data” [online] https://data.worldbank.org/.<br />
a<br />
Countries that maintained export and import flows with Chile continuously throughout 2006-2014.<br />
5 000<br />
4 500<br />
4 000<br />
3 500<br />
3 000<br />
2 500<br />
2 000<br />
1 500<br />
1 000<br />
500<br />
Figure 2<br />
Export costs in 132 countries, 2010 a<br />
(Dollars and countries)<br />
0<br />
0 20 40 60 80 100 120 140<br />
Source: Prepared by the authors, on the basis of data from World Bank, “World Bank Open Data” [online] https://data.worldbank.org/.<br />
a<br />
Countries that maintained export and import flows with Chile continuously throughout 2006-2014.<br />
The average export cost in the Southern Cone countries rose from US$ 966.67 per-container in<br />
2005 to US$ 1,772.9 in 2014, driven particularly by costs in the Bolivarian Republic of Venezuela, Brazil<br />
and Colombia. In 2005, these countries had the lowest per-container export costs, along with Peru;<br />
but in 2007, 2008 and 2009, costs rose drastically. In particular, between 2012 and 2014, there was a<br />
significant increase in per-container export costs in the Bolivarian Republic of Venezuela (US$ 3,490),<br />
Brazil (US$ 2,414), Colombia (US$ 2,355), Paraguay (US$ 1,850) and Argentina (US$ 1,650). Chile<br />
and Peru have succeeded in maintaining the lowest costs per-container in South America: in 2014,<br />
the average cost was US$ 890 in Peru and US$ 980 in Chile.<br />
Trade facilitation and its effects on Chile’s bilateral trade between 2006 and 2014


