

CEPAL Review no. 124
April 2018
April 2018

You also want an ePaper? Increase the reach of your titles
YUMPU automatically turns print PDFs into web optimized ePapers that Google loves.
<strong>CEPAL</strong> <strong>Review</strong> N° <strong>124</strong> • April 2018<br />
19<br />
can be interpreted as reflecting the differences in the cost of achieving a similar level of wellbeing<br />
between countries.<br />
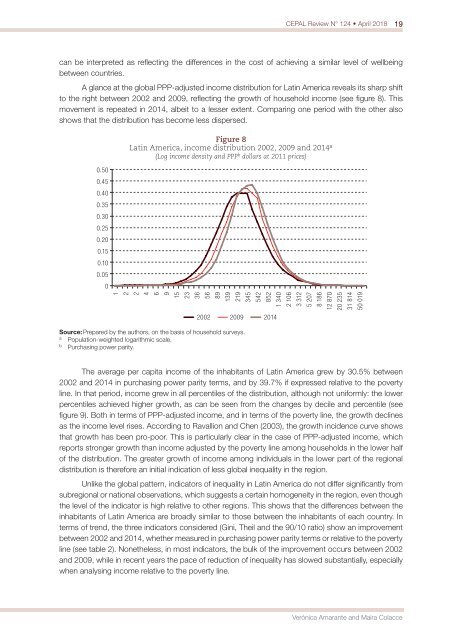
A glance at the global PPP-adjusted income distribution for Latin America reveals its sharp shift<br />
to the right between 2002 and 2009, reflecting the growth of household income (see figure 8). This<br />
movement is repeated in 2014, albeit to a lesser extent. Comparing one period with the other also<br />
shows that the distribution has become less dispersed.<br />
0.50<br />
0.45<br />
0.40<br />
0.35<br />
0.30<br />
0.25<br />
0.20<br />
0.15<br />
0.10<br />
0.05<br />
0<br />
Figure 8<br />
Latin America, income distribution 2002, 2009 and 2014 a<br />
(Log income density and PPP b dollars at 2011 prices)<br />
1<br />
2<br />
2<br />
4<br />
6<br />
9<br />
15<br />
23<br />
36<br />
56<br />
89<br />
139<br />
219<br />
345<br />
542<br />
852<br />
1 340<br />
2 106<br />
3 312<br />
5 207<br />
8 186<br />
12 870<br />
20 235<br />
31 814<br />
50 019<br />
2002 2009 2014<br />
Source: Prepared by the authors, on the basis of household surveys.<br />
a<br />
Population-weighted logarithmic scale.<br />
b<br />
Purchasing power parity.<br />
The average per capita income of the inhabitants of Latin America grew by 30.5% between<br />
2002 and 2014 in purchasing power parity terms, and by 39.7% if expressed relative to the poverty<br />
line. In that period, income grew in all percentiles of the distribution, although <strong>no</strong>t uniformly: the lower<br />
percentiles achieved higher growth, as can be seen from the changes by decile and percentile (see<br />
figure 9). Both in terms of PPP-adjusted income, and in terms of the poverty line, the growth declines<br />
as the income level rises. According to Ravallion and Chen (2003), the growth incidence curve shows<br />
that growth has been pro-poor. This is particularly clear in the case of PPP-adjusted income, which<br />
reports stronger growth than income adjusted by the poverty line among households in the lower half<br />
of the distribution. The greater growth of income among individuals in the lower part of the regional<br />
distribution is therefore an initial indication of less global inequality in the region.<br />
Unlike the global pattern, indicators of inequality in Latin America do <strong>no</strong>t differ significantly from<br />
subregional or national observations, which suggests a certain homogeneity in the region, even though<br />
the level of the indicator is high relative to other regions. This shows that the differences between the<br />
inhabitants of Latin America are broadly similar to those between the inhabitants of each country. In<br />
terms of trend, the three indicators considered (Gini, Theil and the 90/10 ratio) show an improvement<br />
between 2002 and 2014, whether measured in purchasing power parity terms or relative to the poverty<br />
line (see table 2). Nonetheless, in most indicators, the bulk of the improvement occurs between 2002<br />
and 2009, while in recent years the pace of reduction of inequality has slowed substantially, especially<br />
when analysing income relative to the poverty line.<br />
Verónica Amarante and Maira Colacce


