

CEPAL Review no. 124
April 2018
April 2018

You also want an ePaper? Increase the reach of your titles
YUMPU automatically turns print PDFs into web optimized ePapers that Google loves.
<strong>CEPAL</strong> <strong>Review</strong> N° <strong>124</strong> • April 2018 189<br />
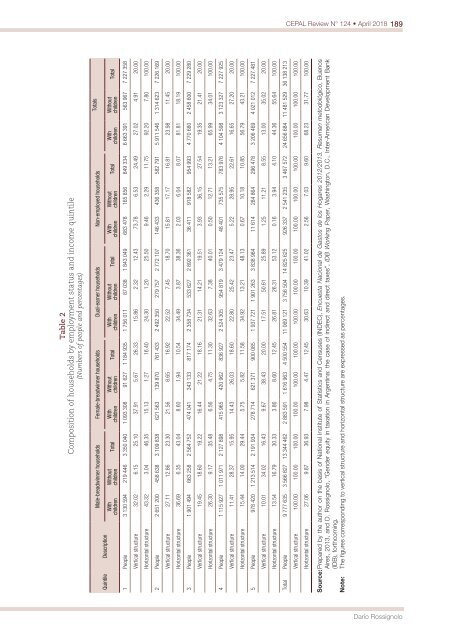
Table 2<br />
Composition of households by employment status and income quintile<br />
(Numbers of people and percentages)<br />
Quintile Description<br />
Male-breadwinner households Female-breadwinner households Dual-earner households Non-employed households<br />
With<br />
children<br />
Without<br />
children<br />
Total<br />
With<br />
children<br />
Without<br />
children<br />
Total<br />
With<br />
children<br />
1 People 3 130 594 219 446 3 350 040 1 093 308 91 627 1 184 935 1 756 011 87 038 1 843 049 683 478 165 856 849 334 6 663 391 563 967 7 227 358<br />
Without<br />
children<br />
Total<br />
With<br />
children<br />
Without<br />
children<br />
Total<br />
With<br />
children<br />
Totals<br />
Without<br />
children<br />
Total<br />
Vertical structure 32.02 6.15 25.10 37.91 5.67 26.33 15.86 2.32 12.43 73.78 6.53 24.49 27.02 4.91 20.00<br />
Horizontal structure 43.32 3.04 46.35 15.13 1.27 16.40 24.30 1.20 25.50 9.46 2.29 11.75 92.20 7.80 100.00<br />
2 People 2 651 200 458 638 3 109 838 621 563 139 870 761 433 2 492 350 279 757 2 772 107 146 433 436 358 582 791 5 911 546 1 314 623 7 226 169<br />
Vertical structure 27.11 12.86 23.30 21.56 8.65 16.92 22.52 7.45 18.70 15.81 17.17 16.81 23.98 11.45 20.00<br />
Horizontal structure 36.69 6.35 43.04 8.60 1.94 10.54 34.49 3.87 38.36 2.03 6.04 8.07 81.81 18.19 100.00<br />
3 People 1 901 494 663 258 2 564 752 474 041 343 133 817 174 2 358 734 533 627 2 892 361 36 411 918 582 954 993 4 770 680 2 458 600 7 229 280<br />
Vertical structure 19.45 18.60 19.22 16.44 21.22 18.16 21.31 14.21 19.51 3.93 36.15 27.54 19.35 21.41 20.00<br />
Horizontal structure 26.30 9.17 35.48 6.56 4.75 11.30 32.63 7.38 40.01 0.50 12.71 13.21 65.99 34.01 100.00<br />
4 People 1 115 927 1 011 971 2 127 898 415 965 420 962 836 927 2 524 305 954 819 3 479 <strong>124</strong> 48 401 735 575 783 976 4 104 598 3 123 327 7 227 925<br />
Vertical structure 11.41 28.37 15.95 14.43 26.03 18.60 22.80 25.42 23.47 5.22 28.95 22.61 16.65 27.20 20.00<br />
Horizontal structure 15.44 14.00 29.44 5.75 5.82 11.58 34.92 13.21 48.13 0.67 10.18 10.85 56.79 43.21 100.00<br />
5 People 978 420 1 213 514 2 191 934 278 714 621 371 900 085 1 937 721 1 901 263 3 838 984 11 614 284 864 296 478 3 206 469 4 021 012 7 227 481<br />
Vertical structure 10.01 34.02 16.43 9.67 38.43 20.00 17.51 50.61 25.89 1.25 11.21 8.55 13.00 35.02 20.00<br />
Horizontal structure 13.54 16.79 30.33 3.86 8.60 12.45 26.81 26.31 53.12 0.16 3.94 4.10 44.36 55.64 100.00<br />
Total People 9 777 635 3 566 827 13 344 462 2 883 591 1 616 963 4 500 554 11 069 121 3 756 504 14 825 625 926 337 2 541 235 3 467 572 24 656 684 11 481 529 36 138 213<br />
Vertical structure 100.00 100.00 100.00 100.00 100.00 100.00 100.00 100.00 100.00 100.00 100.00 100.00 100.00 100.00 100.00<br />
Horizontal structure 27.06 9.87 36.93 7.98 4.47 12.45 30.63 10.39 41.02 2.56 7.03 9.60 68.23 31.77 100.00<br />
Source: Prepared by the author on the basis of National Institute of Statistics and Censuses (INDEC), Encuesta Nacional de Gastos de los Hogares 2012/2013. Resumen metodológico, Bue<strong>no</strong>s<br />
Aires, 2013, and D. Rossig<strong>no</strong>lo, “Gender equity in taxation in Argentina: the case of indirect and direct taxes”, IDB Working Paper, Washington, D.C., Inter-American Development Bank<br />
(IDB), forthcoming.<br />
Note: The figures corresponding to vertical structure and horizontal structure are expressed as percentages.<br />
Darío Rossig<strong>no</strong>lo


