

CEPAL Review no. 124
April 2018
April 2018

Create successful ePaper yourself
Turn your PDF publications into a flip-book with our unique Google optimized e-Paper software.
<strong>CEPAL</strong> <strong>Review</strong> N° <strong>124</strong> • April 2018<br />
17<br />
proportion of people with per capita incomes of less than US$ 2 per day (in purchasing power parity<br />
terms at 2005 prices) fell from 84% in 1987 to just under 19% in 2011. Relative to a poverty line of<br />
US$ 1.25, the poverty rate fell from 54% to 6% in the same period.<br />
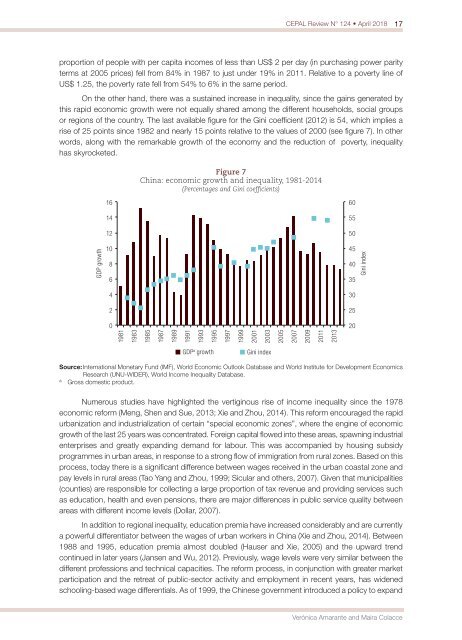
On the other hand, there was a sustained increase in inequality, since the gains generated by<br />
this rapid eco<strong>no</strong>mic growth were <strong>no</strong>t equally shared among the different households, social groups<br />
or regions of the country. The last available figure for the Gini coefficient (2012) is 54, which implies a<br />
rise of 25 points since 1982 and nearly 15 points relative to the values of 2000 (see figure 7). In other<br />
words, along with the remarkable growth of the eco<strong>no</strong>my and the reduction of poverty, inequality<br />
has skyrocketed.<br />
Figure 7<br />
China: eco<strong>no</strong>mic growth and inequality, 1981-2014<br />
(Percentages and Gini coefficients)<br />
16<br />
60<br />
14<br />
55<br />
12<br />
50<br />
GDP growth<br />
10<br />
8<br />
6<br />
45<br />
40<br />
35<br />
Gini index<br />
4<br />
30<br />
2<br />
25<br />
0<br />
20<br />
1981<br />
1983<br />
1985<br />
1987<br />
1989<br />
1991<br />
1993<br />
1995<br />
1997<br />
1999<br />
2001<br />
2003<br />
2005<br />
2007<br />
2009<br />
2011<br />
2013<br />
GDP a growth<br />
Gini index<br />
Source: International Monetary Fund (IMF), World Eco<strong>no</strong>mic Outlook Database and World Institute for Development Eco<strong>no</strong>mics<br />
Research (UNU-WIDER), World Income Inequality Database.<br />
a<br />
Gross domestic product.<br />
Numerous studies have highlighted the vertigi<strong>no</strong>us rise of income inequality since the 1978<br />
eco<strong>no</strong>mic reform (Meng, Shen and Sue, 2013; Xie and Zhou, 2014). This reform encouraged the rapid<br />
urbanization and industrialization of certain “special eco<strong>no</strong>mic zones”, where the engine of eco<strong>no</strong>mic<br />
growth of the last 25 years was concentrated. Foreign capital flowed into these areas, spawning industrial<br />
enterprises and greatly expanding demand for labour. This was accompanied by housing subsidy<br />
programmes in urban areas, in response to a strong flow of immigration from rural zones. Based on this<br />
process, today there is a significant difference between wages received in the urban coastal zone and<br />
pay levels in rural areas (Tao Yang and Zhou, 1999; Sicular and others, 2007). Given that municipalities<br />
(counties) are responsible for collecting a large proportion of tax revenue and providing services such<br />
as education, health and even pensions, there are major differences in public service quality between<br />
areas with different income levels (Dollar, 2007).<br />
In addition to regional inequality, education premia have increased considerably and are currently<br />
a powerful differentiator between the wages of urban workers in China (Xie and Zhou, 2014). Between<br />
1988 and 1995, education premia almost doubled (Hauser and Xie, 2005) and the upward trend<br />
continued in later years (Jansen and Wu, 2012). Previously, wage levels were very similar between the<br />
different professions and technical capacities. The reform process, in conjunction with greater market<br />
participation and the retreat of public-sector activity and employment in recent years, has widened<br />
schooling-based wage differentials. As of 1999, the Chinese government introduced a policy to expand<br />
Verónica Amarante and Maira Colacce


