

CEPAL Review no. 124
April 2018
April 2018

Create successful ePaper yourself
Turn your PDF publications into a flip-book with our unique Google optimized e-Paper software.
204 <strong>CEPAL</strong> <strong>Review</strong> N° <strong>124</strong> • April 2018<br />
I. Introduction<br />
High and rising debt levels undermine a country’s credit rating, thereby generating greater uncertainty<br />
in financial markets and driving up the risk premium. This forces the country in question to spend<br />
more on debt service, thereby putting greater pressure on other expenditure. In many cases, the only<br />
way to reduce the deficit in the short term is by cutting back on public spending, which has negative<br />
social consequences.<br />
The dynamics and sustainability of the public debt depend on the behaviour of the public deficit<br />
and its interrelationship with the different phases of the business cycle, its vulnerability or volatility in the<br />
face of exoge<strong>no</strong>us shocks, capital markets, domestic and external interest rates, and the real exchange<br />
rate. A country’s net public debt represents accumulated past fiscal outturns, while future balances<br />
incorporate the resulting interest income and expenses. Systematic fiscal imbalances will thus generate<br />
future interest expenditure, which in turn will contribute to the accumulation of new debt.<br />
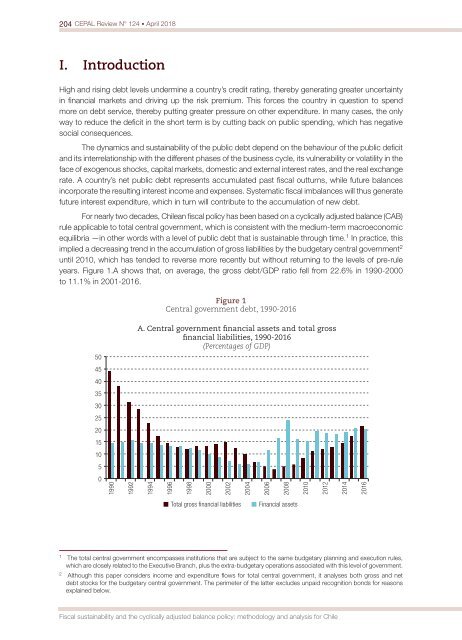
For nearly two decades, Chilean fiscal policy has been based on a cyclically adjusted balance (CAB)<br />
rule applicable to total central government, which is consistent with the medium-term macroeco<strong>no</strong>mic<br />
equilibria —in other words with a level of public debt that is sustainable through time. 1 In practice, this<br />
implied a decreasing trend in the accumulation of gross liabilities by the budgetary central government 2<br />
until 2010, which has tended to reverse more recently but without returning to the levels of pre-rule<br />
years. Figure 1.A shows that, on average, the gross debt/GDP ratio fell from 22.6% in 1990-2000<br />
to 11.1% in 2001-2016.<br />
Figure 1<br />
Central government debt, 1990-2016<br />
A. Central government financial assets and total gross<br />
financial liabilities, 1990-2016<br />
(Percentages of GDP)<br />
50<br />
45<br />
40<br />
35<br />
30<br />
25<br />
20<br />
15<br />
10<br />
5<br />
0<br />
1990<br />
1992<br />
1994<br />
1996<br />
1998<br />
2000<br />
2002<br />
2004<br />
2006<br />
2008<br />
2010<br />
2012<br />
2014<br />
2016<br />
Total gross financial liabilities<br />
Financial assets<br />
1<br />
The total central government encompasses institutions that are subject to the same budgetary planning and execution rules,<br />
which are closely related to the Executive Branch, plus the extra-budgetary operations associated with this level of government.<br />
2<br />
Although this paper considers income and expenditure flows for total central government, it analyses both gross and net<br />
debt stocks for the budgetary central government. The perimeter of the latter excludes unpaid recognition bonds for reasons<br />
explained below.<br />
Fiscal sustainability and the cyclically adjusted balance policy: methodology and analysis for Chile


