

CEPAL Review no. 124
April 2018
April 2018

Create successful ePaper yourself
Turn your PDF publications into a flip-book with our unique Google optimized e-Paper software.
<strong>CEPAL</strong> <strong>Review</strong> N° <strong>124</strong> • April 2018 209<br />
IV. Fiscal sustainability of the Chilean eco<strong>no</strong>my<br />
1. Static indicators of vulnerability<br />
and fiscal sustainability<br />
The following paragraphs discuss the ex post calculation of selected indicators of vulnerability and fiscal<br />
sustainability adapted to the Chilean reality. 9<br />
The debt measurement presented below covers the budgetary central government, 10 thereby<br />
excluding from the analysis the assets and liabilities of the Central Bank of Chile, public enterprises,<br />
universities and municipalities. The measurement of the gross liabilities of the budgetary central<br />
government also excludes the stock of unpaid recognition bonds, which represent a liability owed to<br />
affiliates of the old pension regime who transferred to the pension fund management (AFP) system. As<br />
the stock of recognition bonds is judged to be a different type of liability than the traditional concept<br />
of central government debt, and in keeping with international practices, these statistics are presented<br />
in a complementary manner and tend <strong>no</strong>t to be consolidated into central government debt statistics.<br />
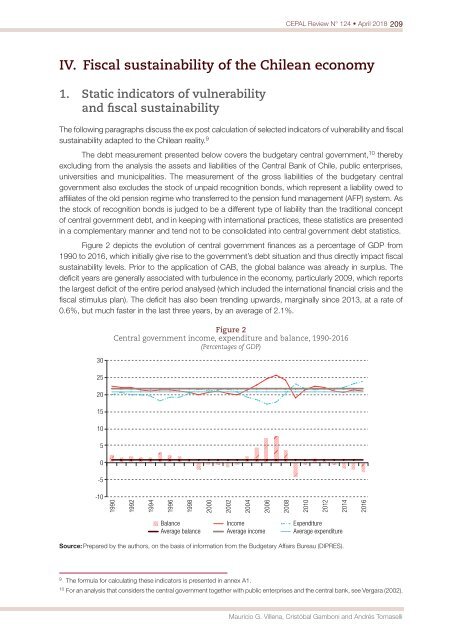
Figure 2 depicts the evolution of central government finances as a percentage of GDP from<br />
1990 to 2016, which initially give rise to the government’s debt situation and thus directly impact fiscal<br />
sustainability levels. Prior to the application of CAB, the global balance was already in surplus. The<br />
deficit years are generally associated with turbulence in the eco<strong>no</strong>my, particularly 2009, which reports<br />
the largest deficit of the entire period analysed (which included the international financial crisis and the<br />
fiscal stimulus plan). The deficit has also been trending upwards, marginally since 2013, at a rate of<br />
0.6%, but much faster in the last three years, by an average of 2.1%.<br />
30<br />
25<br />
20<br />
15<br />
10<br />
5<br />
0<br />
-5<br />
Figure 2<br />
Central government income, expenditure and balance, 1990-2016<br />
(Percentages of GDP)<br />
-10<br />
1990<br />
1992<br />
1994<br />
1996<br />
1998<br />
2000<br />
2002<br />
2004<br />
2006<br />
2008<br />
2010<br />
2012<br />
2014<br />
2016<br />
Balance Income Expenditure<br />
Average balance Average income Average expenditure<br />
Source: Prepared by the authors, on the basis of information from the Budgetary Affairs Bureau (DIPRES).<br />
9<br />
The formula for calculating these indicators is presented in annex A1.<br />
10<br />
For an analysis that considers the central government together with public enterprises and the central bank, see Vergara (2002).<br />
Mauricio G. Villena, Cristóbal Gamboni and Andrés Tomaselli


