

CEPAL Review no. 124
April 2018
April 2018

Create successful ePaper yourself
Turn your PDF publications into a flip-book with our unique Google optimized e-Paper software.
<strong>CEPAL</strong> <strong>Review</strong> N° <strong>124</strong> • April 2018 151<br />
The firms’ real marginal cost was constructed, following Galí and Gertler (1999), on the basis<br />
of the product of the series of real average income of employed persons and the total number of<br />
employees 14 —produced from the IBGE Monthly Employment Survey (PME) and published by the<br />
Central Bank of Brazil— and division of the result by gross domestic product (GDP), also provided by<br />
the Central Bank of Brazil.<br />
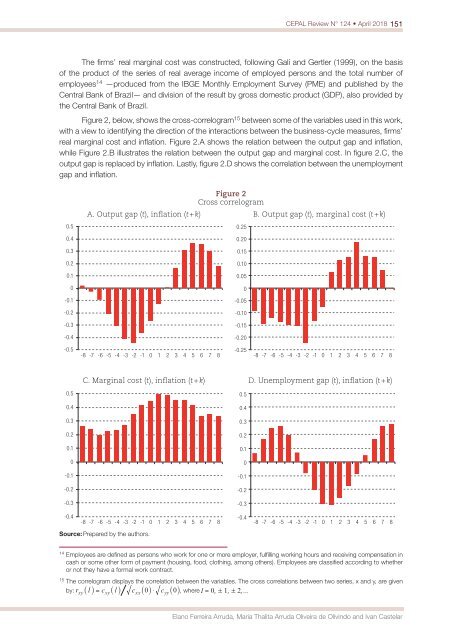
Figure 2, below, shows the cross-correlogram 15 between some of the variables used in this work,<br />
with a view to identifying the direction of the interactions between the business-cycle measures, firms’<br />
real marginal cost and inflation. Figure 2.A shows the relation between the output gap and inflation,<br />
while Figure 2.B illustrates the relation between the output gap and marginal cost. In figure 2.C, the<br />
output gap is replaced by inflation. Lastly, figure 2.D shows the correlation between the unemployment<br />
gap and inflation.<br />
Figure 2<br />
Cross correlogram<br />
A. Output gap (t), inflation (t + k) B. Output gap (t), marginal cost (t + k)<br />
0.5<br />
0.25<br />
0.4<br />
0.20<br />
0.3<br />
0.15<br />
0.2<br />
0.10<br />
0.1<br />
0.05<br />
0<br />
0<br />
-0.1<br />
-0.05<br />
-0.2<br />
-0.10<br />
-0.3<br />
-0.15<br />
-0.4<br />
-0.20<br />
-0.5<br />
-8 -7 -6 -5 -4 -3 -2 -1 0 1 2 3 4 5 6 7 8<br />
-0.25<br />
-8 -7 -6 -5 -4 -3 -2 -1 0 1 2 3 4 5 6 7 8<br />
C. Marginal cost (t), inflation (t + k) D. Unemployment gap (t), inflation (t + k)<br />
0.5<br />
0.5<br />
0.4<br />
0.4<br />
0.3<br />
0.3<br />
0.2<br />
0.2<br />
0.1<br />
0.1<br />
0<br />
0<br />
-0.1<br />
-0.1<br />
-0.2<br />
-0.2<br />
-0.3<br />
-0.3<br />
-0.4<br />
-8 -7 -6 -5 -4 -3 -2 -1 0 1 2 3 4 5 6 7 8<br />
-0.4<br />
-8 -7 -6 -5 -4 -3 -2 -1 0 1 2 3 4 5 6 7 8<br />
Source: Prepared by the authors.<br />
14<br />
Employees are defined as persons who work for one or more employer, fulfilling working hours and receiving compensation in<br />
cash or some other form of payment (housing, food, clothing, among others). Employees are classified according to whether<br />
or <strong>no</strong>t they have a formal work contract.<br />
15<br />
The correlogram displays the correlation between the variables. The cross correlations between two series, x and y, are given<br />
by:<br />
, where<br />
Ela<strong>no</strong> Ferreira Arruda, Maria Thalita Arruda Oliveira de Olivindo and Ivan Castelar


