

CEPAL Review no. 124
April 2018
April 2018

Create successful ePaper yourself
Turn your PDF publications into a flip-book with our unique Google optimized e-Paper software.
<strong>CEPAL</strong> <strong>Review</strong> N° <strong>124</strong> • April 2018<br />
21<br />
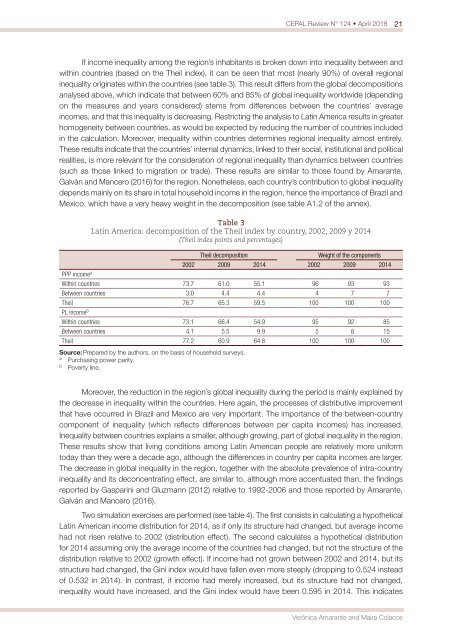
If income inequality among the region’s inhabitants is broken down into inequality between and<br />
within countries (based on the Theil index), it can be seen that most (nearly 90%) of overall regional<br />
inequality originates within the countries (see table 3). This result differs from the global decompositions<br />
analysed above, which indicate that between 60% and 85% of global inequality worldwide (depending<br />
on the measures and years considered) stems from differences between the countries’ average<br />
incomes, and that this inequality is decreasing. Restricting the analysis to Latin America results in greater<br />
homogeneity between countries, as would be expected by reducing the number of countries included<br />
in the calculation. Moreover, inequality within countries determines regional inequality almost entirely.<br />
These results indicate that the countries’ internal dynamics, linked to their social, institutional and political<br />
realities, is more relevant for the consideration of regional inequality than dynamics between countries<br />
(such as those linked to migration or trade). These results are similar to those found by Amarante,<br />
Galván and Mancero (2016) for the region. Nonetheless, each country’s contribution to global inequality<br />
depends mainly on its share in total household income in the region, hence the importance of Brazil and<br />
Mexico, which have a very heavy weight in the decomposition (see table A1.2 of the annex).<br />
Table 3<br />
Latin America: decomposition of the Theil index by country, 2002, 2009 y 2014<br />
(Theil index points and percentages)<br />
Theil decomposition<br />
Weight of the components<br />
2002 2009 2014 2002 2009 2014<br />
PPP income a<br />
Within countries 73.7 61.0 55.1 96 93 93<br />
Between countries 3.0 4.4 4.4 4 7 7<br />
Theil 76.7 65.3 59.5 100 100 100<br />
PL income b<br />
Within countries 73.1 66.4 54.9 95 92 85<br />
Between countries 4.1 5.5 9.9 5 8 15<br />
Theil 77.2 60.9 64.8 100 100 100<br />
Source: Prepared by the authors, on the basis of household surveys.<br />
a<br />
Purchasing power parity.<br />
b<br />
Poverty line.<br />
Moreover, the reduction in the region’s global inequality during the period is mainly explained by<br />
the decrease in inequality within the countries. Here again, the processes of distributive improvement<br />
that have occurred in Brazil and Mexico are very important. The importance of the between-country<br />
component of inequality (which reflects differences between per capita incomes) has increased.<br />
Inequality between countries explains a smaller, although growing, part of global inequality in the region.<br />
These results show that living conditions among Latin American people are relatively more uniform<br />
today than they were a decade ago, although the differences in country per capita incomes are larger.<br />
The decrease in global inequality in the region, together with the absolute prevalence of intra-country<br />
inequality and its deconcentrating effect, are similar to, although more accentuated than, the findings<br />
reported by Gasparini and Gluzmann (2012) relative to 1992-2006 and those reported by Amarante,<br />
Galván and Mancero (2016).<br />
Two simulation exercises are performed (see table 4). The first consists in calculating a hypothetical<br />
Latin American income distribution for 2014, as if only its structure had changed, but average income<br />
had <strong>no</strong>t risen relative to 2002 (distribution effect). The second calculates a hypothetical distribution<br />
for 2014 assuming only the average income of the countries had changed, but <strong>no</strong>t the structure of the<br />
distribution relative to 2002 (growth effect). If income had <strong>no</strong>t grown between 2002 and 2014, but its<br />
structure had changed, the Gini index would have fallen even more steeply (dropping to 0.524 instead<br />
of 0.532 in 2014). In contrast, if income had merely increased, but its structure had <strong>no</strong>t changed,<br />
inequality would have increased, and the Gini index would have been 0.595 in 2014. This indicates<br />
Verónica Amarante and Maira Colacce


