

CEPAL Review no. 124
April 2018
April 2018

You also want an ePaper? Increase the reach of your titles
YUMPU automatically turns print PDFs into web optimized ePapers that Google loves.
218 <strong>CEPAL</strong> <strong>Review</strong> N° <strong>124</strong> • April 2018<br />
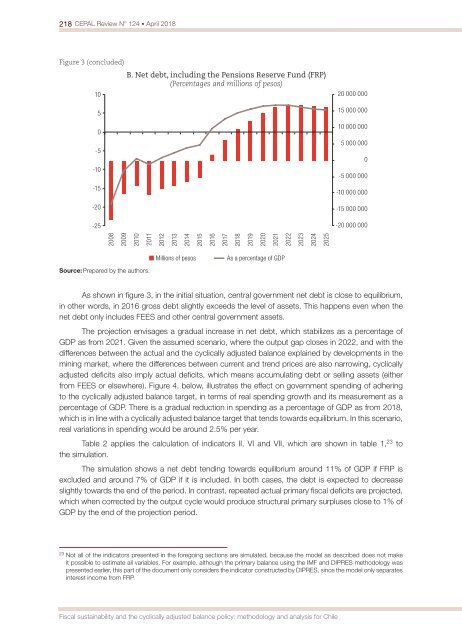
Figure 3 (concluded)<br />
B. Net debt, including the Pensions Reserve Fund (FRP)<br />
(Percentages and millions of pesos)<br />
10<br />
5<br />
0<br />
-5<br />
-10<br />
-15<br />
-20<br />
-25<br />
20 000 000<br />
15 000 000<br />
10 000 000<br />
5 000 000<br />
0<br />
-5 000 000<br />
-10 000 000<br />
-15 000 000<br />
-20 000 000<br />
2008<br />
2009<br />
2010<br />
2011<br />
2012<br />
2013<br />
2014<br />
2015<br />
2016<br />
2017<br />
2018<br />
2019<br />
2020<br />
2021<br />
2022<br />
2023<br />
2024<br />
2025<br />
Source: Prepared by the authors.<br />
Millions of pesos<br />
As a percentage of GDP<br />
As shown in figure 3, in the initial situation, central government net debt is close to equilibrium,<br />
in other words, in 2016 gross debt slightly exceeds the level of assets. This happens even when the<br />
net debt only includes FEES and other central government assets.<br />
The projection envisages a gradual increase in net debt, which stabilizes as a percentage of<br />
GDP as from 2021. Given the assumed scenario, where the output gap closes in 2022, and with the<br />
differences between the actual and the cyclically adjusted balance explained by developments in the<br />
mining market, where the differences between current and trend prices are also narrowing, cyclically<br />
adjusted deficits also imply actual deficits, which means accumulating debt or selling assets (either<br />
from FEES or elsewhere). Figure 4, below, illustrates the effect on government spending of adhering<br />
to the cyclically adjusted balance target, in terms of real spending growth and its measurement as a<br />
percentage of GDP. There is a gradual reduction in spending as a percentage of GDP as from 2018,<br />
which is in line with a cyclically adjusted balance target that tends towards equilibrium. In this scenario,<br />
real variations in spending would be around 2.5% per year.<br />
Table 2 applies the calculation of indicators II, VI and VII, which are shown in table 1, 23 to<br />
the simulation.<br />
The simulation shows a net debt tending towards equilibrium around 11% of GDP if FRP is<br />
excluded and around 7% of GDP if it is included. In both cases, the debt is expected to decrease<br />
slightly towards the end of the period. In contrast, repeated actual primary fiscal deficits are projected,<br />
which when corrected by the output cycle would produce structural primary surpluses close to 1% of<br />
GDP by the end of the projection period.<br />
23<br />
Not all of the indicators presented in the foregoing sections are simulated, because the model as described does <strong>no</strong>t make<br />
it possible to estimate all variables. For example, although the primary balance using the IMF and DIPRES methodology was<br />
presented earlier, this part of the document only considers the indicator constructed by DIPRES, since the model only separates<br />
interest income from FRP.<br />
Fiscal sustainability and the cyclically adjusted balance policy: methodology and analysis for Chile


