

CEPAL Review no. 124
April 2018
April 2018

You also want an ePaper? Increase the reach of your titles
YUMPU automatically turns print PDFs into web optimized ePapers that Google loves.
166 <strong>CEPAL</strong> <strong>Review</strong> N° <strong>124</strong> • April 2018<br />
III. Characteristics of the chilean export basket<br />
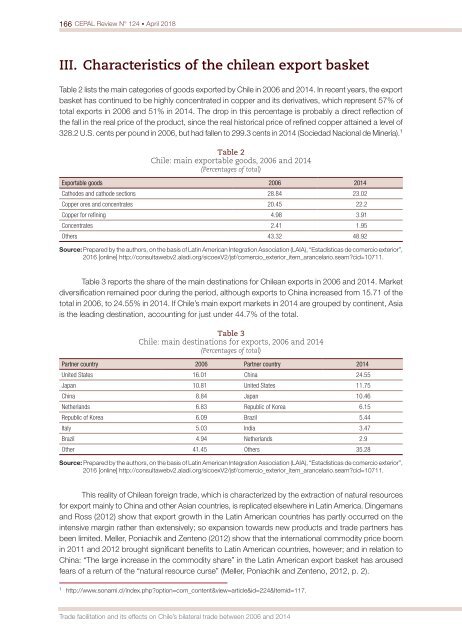
Table 2 lists the main categories of goods exported by Chile in 2006 and 2014. In recent years, the export<br />
basket has continued to be highly concentrated in copper and its derivatives, which represent 57% of<br />
total exports in 2006 and 51% in 2014. The drop in this percentage is probably a direct reflection of<br />
the fall in the real price of the product, since the real historical price of refined copper attained a level of<br />
328.2 U.S. cents per pound in 2006, but had fallen to 299.3 cents in 2014 (Sociedad Nacional de Minería). 1<br />
Table 2<br />
Chile: main exportable goods, 2006 and 2014<br />
(Percentages of total)<br />
Exportable goods 2006 2014<br />
Cathodes and cathode sections 28.84 23.02<br />
Copper ores and concentrates 20.45 22.2<br />
Copper for refining 4.98 3.91<br />
Concentrates 2.41 1.95<br />
Others 43.32 48.92<br />
Source: Prepared by the authors, on the basis of Latin American Integration Association (LAIA), “Estadísticas de comercio exterior”,<br />
2016 [online] http://consultawebv2.aladi.org/sicoexV2/jsf/comercio_exterior_item_arancelario.seam?cid=10711.<br />
Table 3 reports the share of the main destinations for Chilean exports in 2006 and 2014. Market<br />
diversification remained poor during the period, although exports to China increased from 15.71 of the<br />
total in 2006, to 24.55% in 2014. If Chile’s main export markets in 2014 are grouped by continent, Asia<br />
is the leading destination, accounting for just under 44.7% of the total.<br />
Table 3<br />
Chile: main destinations for exports, 2006 and 2014<br />
(Percentages of total)<br />
Partner country 2006 Partner country 2014<br />
United States 16.01 China 24.55<br />
Japan 10.81 United States 11.75<br />
China 8.84 Japan 10.46<br />
Netherlands 6.83 Republic of Korea 6.15<br />
Republic of Korea 6.09 Brazil 5.44<br />
Italy 5.03 India 3.47<br />
Brazil 4.94 Netherlands 2.9<br />
Other 41.45 Others 35.28<br />
Source: Prepared by the authors, on the basis of Latin American Integration Association (LAIA), “Estadísticas de comercio exterior”,<br />
2016 [online] http://consultawebv2.aladi.org/sicoexV2/jsf/comercio_exterior_item_arancelario.seam?cid=10711.<br />
This reality of Chilean foreign trade, which is characterized by the extraction of natural resources<br />
for export mainly to China and other Asian countries, is replicated elsewhere in Latin America. Dingemans<br />
and Ross (2012) show that export growth in the Latin American countries has partly occurred on the<br />
intensive margin rather than extensively; so expansion towards new products and trade partners has<br />
been limited. Meller, Poniachik and Zente<strong>no</strong> (2012) show that the international commodity price boom<br />
in 2011 and 2012 brought significant benefits to Latin American countries, however; and in relation to<br />
China: “The large increase in the commodity share” in the Latin American export basket has aroused<br />
fears of a return of the “natural resource curse” (Meller, Poniachik and Zente<strong>no</strong>, 2012, p. 2).<br />
1<br />
http://www.sonami.cl/index.php?option=com_content&view=article&id=224&Itemid=117.<br />
Trade facilitation and its effects on Chile’s bilateral trade between 2006 and 2014


