

CEPAL Review no. 124
April 2018
April 2018

You also want an ePaper? Increase the reach of your titles
YUMPU automatically turns print PDFs into web optimized ePapers that Google loves.
190 <strong>CEPAL</strong> <strong>Review</strong> N° <strong>124</strong> • April 2018<br />
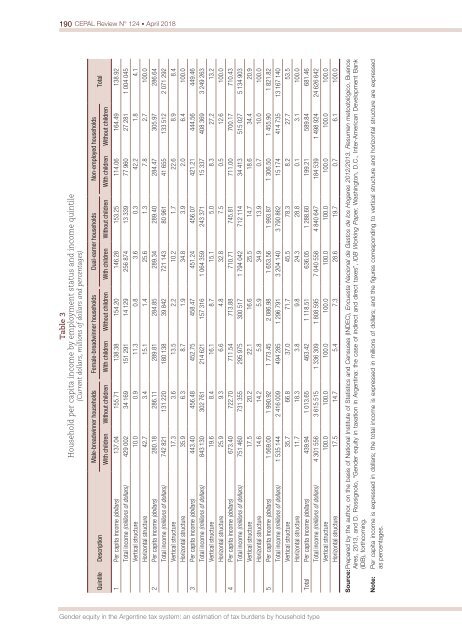
Table 3<br />
Household per capita income by employment status and income quintile<br />
(Current dollars, millions of dollars and percentages)<br />
Quintile Description<br />
Male-breadwinner households Female-breadwinner households Dual-earner households Non-employed households<br />
With children Without children With children Without children With children Without children With children Without children<br />
1 Per capita income (dollars) 137.04 155.71 138.38 154.20 146.28 153.25 114.06 164.49 138.92<br />
Total income (millions of dollars) 429 002 34 169 151 291 14 129 256 874 13 339 77 960 27 281 1 004 045<br />
Vertical structure 10.0 0.9 11.3 0.8 3.6 0.3 42.2 1.8 4.1<br />
Horizontal structure 42.7 3.4 15.1 1.4 25.6 1.3 7.8 2.7 100.0<br />
2 Per capita income (dollars) 280.18 286.11 289.81 284.85 289.34 289.40 284.47 305.97 286.64<br />
Total income (millions of dollars) 742 821 131 220 180 138 39 842 721 143 80 961 41 655 133 512 2 071 292<br />
Vertical structure 17.3 3.6 13.5 2.2 10.2 1.7 22.6 8.9 8.4<br />
Horizontal structure 35.9 6.3 8.7 1.9 34.8 3.9 2.0 6.4 100.0<br />
3 Per capita income (dollars) 443.40 456.48 452.75 458.47 451.24 456.07 421.21 444.56 449.46<br />
Total income (millions of dollars) 843 130 302 761 214 621 157 316 1 064 359 243 371 15 337 408 369 3 249 263<br />
Vertical structure 19.6 8.4 16.1 8.7 15.1 5.0 8.3 27.2 13.2<br />
Horizontal structure 25.9 9.3 6.6 4.8 32.8 7.5 0.5 12.6 100.0<br />
4 Per capita income (dollars) 673.40 722.70 711.54 713.88 710.71 745.81 711.00 700.17 710.43<br />
Total income (millions of dollars) 751 460 731 355 295 975 300 517 1 794 042 712 114 34 413 515 027 5 134 903<br />
Vertical structure 17.5 20.2 22.1 16.6 25.5 14.7 18.6 34.4 20.9<br />
Horizontal structure 14.6 14.2 5.8 5.9 34.9 13.9 0.7 10.0 100.0<br />
5 Per capita income (dollars) 1 569.00 1 990.92 1 773.45 2 086.98 1 653.56 1 993.87 1 306.50 1 455.90 1 821.82<br />
Total income (millions of dollars) 1 535 144 2 416 009 494 285 1 296 791 3 204 140 3 790 862 15 174 414 735 13 167 140<br />
Vertical structure 35.7 66.8 37.0 71.7 45.5 78.3 8.2 27.7 53.5<br />
Horizontal structure 11.7 18.3 3.8 9.8 24.3 28.8 0.1 3.1 100.0<br />
Total Per capita income (dollars) 439.94 1 013.65 463.42 1 118.51 636.05 1 288.60 199.21 589.84 681.46<br />
Total income (millions of dollars) 4 301 556 3 615 515 1 336 309 1 808 595 7 040 558 4 840 647 184 539 1 498 924 24 626 642<br />
Vertical structure 100.0 100.0 100.0 100.0 100.0 100.0 100.0 100.0 100.0<br />
Horizontal structure 17.5 14.7 5.4 7.3 28.6 19.7 0.7 6.1 100.0<br />
Total<br />
Source: Prepared by the author, on the basis of National Institute of Statistics and Censuses (INDEC), Encuesta Nacional de Gastos de los Hogares 2012/2013. Resumen metodológico, Bue<strong>no</strong>s<br />
Aires, 2013, and D. Rossig<strong>no</strong>lo, “Gender equity in taxation in Argentina: the case of indirect and direct taxes”, IDB Working Paper, Washington, D.C., Inter-American Development Bank<br />
(IDB), forthcoming.<br />
Note: Per capita income is expressed in dollars; the total income is expressed in millions of dollars; and the figures corresponding to vertical structure and horizontal structure are expressed<br />
as percentages.<br />
Gender equity in the Argentine tax system: an estimation of tax burdens by household type


