

CEPAL Review no. 124
April 2018
April 2018

You also want an ePaper? Increase the reach of your titles
YUMPU automatically turns print PDFs into web optimized ePapers that Google loves.
82 <strong>CEPAL</strong> <strong>Review</strong> N° <strong>124</strong> • April 2018<br />
Period: 1988-2007<br />
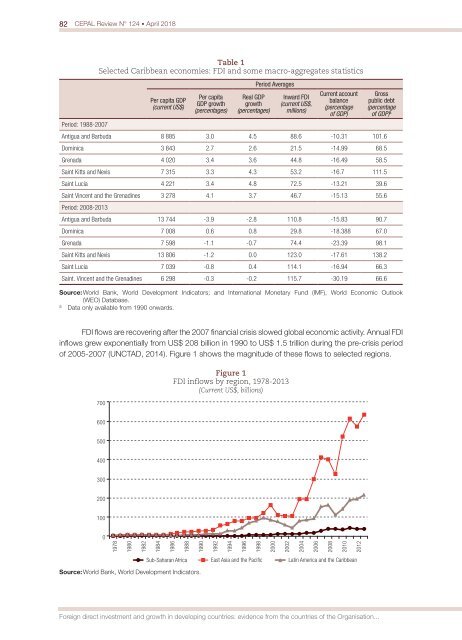
Table 1<br />
Selected Caribbean eco<strong>no</strong>mies: FDI and some macro-aggregates statistics<br />
Per capita GDP<br />
(current US$)<br />
Per capita<br />
GDP growth<br />
(percentages)<br />
Real GDP<br />
growth<br />
(percentages)<br />
Period Averages<br />
Inward FDI<br />
(current US$,<br />
millions)<br />
Current account<br />
balance<br />
(percentage<br />
of GDP)<br />
Gross<br />
public debt<br />
(percentage<br />
of GDP) a<br />
Antigua and Barbuda 8 885 3.0 4.5 88.6 -10.31 101.6<br />
Dominica 3 843 2.7 2.6 21.5 -14.99 68.5<br />
Grenada 4 020 3.4 3.6 44.8 -16.49 58.5<br />
Saint Kitts and Nevis 7 315 3.3 4.3 53.2 -16.7 111.5<br />
Saint Lucia 4 221 3.4 4.8 72.5 -13.21 39.6<br />
Saint Vincent and the Grenadines 3 278 4.1 3.7 46.7 -15.13 55.6<br />
Period: 2008-2013<br />
Antigua and Barbuda 13 744 -3.9 -2.8 110.8 -15.83 90.7<br />
Dominica 7 008 0.6 0.8 29.8 -18.388 67.0<br />
Grenada 7 598 -1.1 -0.7 74.4 -23.39 98.1<br />
Saint Kitts and Nevis 13 806 -1.2 0.0 123.0 -17.61 138.2<br />
Saint Lucia 7 039 -0.8 0.4 114.1 -16.94 66.3<br />
Saint. Vincent and the Grenadines 6 298 -0.3 -0.2 115.7 -30.19 66.6<br />
Source: World Bank, World Development Indicators; and International Monetary Fund (IMF), World Eco<strong>no</strong>mic Outlook<br />
(WEO) Database.<br />
a<br />
Data only available from 1990 onwards.<br />
FDI flows are recovering after the 2007 financial crisis slowed global eco<strong>no</strong>mic activity. Annual FDI<br />
inflows grew exponentially from US$ 208 billion in 1990 to US$ 1.5 trillion during the pre-crisis period<br />
of 2005-2007 (UNCTAD, 2014). Figure 1 shows the magnitude of these flows to selected regions.<br />
700<br />
Figure 1<br />
FDI inflows by region, 1978-2013<br />
(Current US$, billions)<br />
600<br />
500<br />
400<br />
300<br />
200<br />
100<br />
0<br />
1978<br />
1980<br />
1982<br />
1984<br />
1986<br />
1988<br />
1990<br />
1992<br />
1994<br />
1996<br />
1998<br />
2000<br />
2002<br />
2004<br />
2006<br />
2008<br />
2010<br />
2012<br />
Sub-Saharan Africa East Asia and the Pacific Latin America and the Caribbean<br />
Source: World Bank, World Development Indicators.<br />
Foreign direct investment and growth in developing countries: evidence from the countries of the Organisation...


