

CEPAL Review no. 124
April 2018
April 2018

Create successful ePaper yourself
Turn your PDF publications into a flip-book with our unique Google optimized e-Paper software.
26 <strong>CEPAL</strong> <strong>Review</strong> N° <strong>124</strong> • April 2018<br />
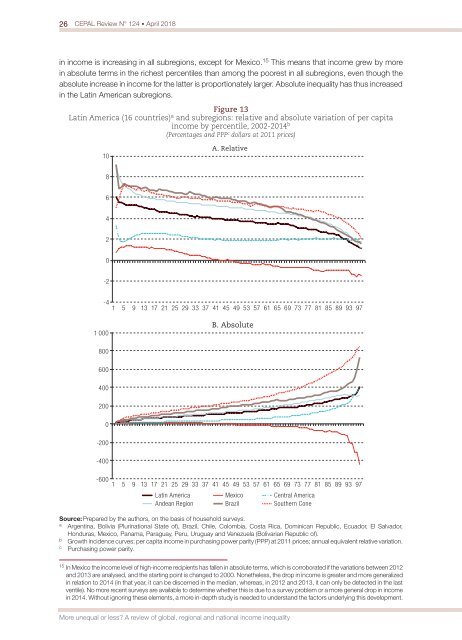
in income is increasing in all subregions, except for Mexico. 15 This means that income grew by more<br />
in absolute terms in the richest percentiles than among the poorest in all subregions, even though the<br />
absolute increase in income for the latter is proportionately larger. Absolute inequality has thus increased<br />
in the Latin American subregions.<br />
Figure 13<br />
Latin America (16 countries) a and subregions: relative and absolute variation of per capita<br />
income by percentile, 2002-2014 b<br />
(Percentages and PPP c dollars at 2011 prices)<br />
10<br />
A. Relative<br />
8<br />
6<br />
4<br />
2<br />
0<br />
-2<br />
-4<br />
1 5 9 13 17 21 25 29 33 37 41 45 49 53 57 61 65 69 73 77 81 85 89 93 97<br />
1 000<br />
B. Absolute<br />
800<br />
600<br />
400<br />
200<br />
0<br />
-200<br />
-400<br />
-600<br />
1 5 9 13 17 21 25 29 33 37 41 45 49 53 57 61 65 69 73 77 81 85 89 93 97<br />
Latin America Mexico Central America<br />
Andean Region Brazil Southern Cone<br />
Source: Prepared by the authors, on the basis of household surveys.<br />
a<br />
Argentina, Bolivia (Plurinational State of), Brazil, Chile, Colombia, Costa Rica, Dominican Republic, Ecuador, El Salvador,<br />
Honduras, Mexico, Panama, Paraguay, Peru, Uruguay and Venezuela (Bolivarian Republic of).<br />
b<br />
Growth incidence curves; per capita income in purchasing power parity (PPP) at 2011 prices; annual equivalent relative variation.<br />
c<br />
Purchasing power parity.<br />
15<br />
In Mexico the income level of high-income recipients has fallen in absolute terms, which is corroborated if the variations between 2012<br />
and 2013 are analysed, and the starting point is changed to 2000. Nonetheless, the drop in income is greater and more generalized<br />
in relation to 2014 (in that year, it can be discerned in the median, whereas, in 2012 and 2013, it can only be detected in the last<br />
ventile). No more recent surveys are available to determine whether this is due to a survey problem or a more general drop in income<br />
in 2014. Without ig<strong>no</strong>ring these elements, a more in-depth study is needed to understand the factors underlying this development.<br />
More unequal or less? A review of global, regional and national income inequality


