

CEPAL Review no. 124
April 2018
April 2018

Create successful ePaper yourself
Turn your PDF publications into a flip-book with our unique Google optimized e-Paper software.
110 <strong>CEPAL</strong> <strong>Review</strong> N° <strong>124</strong> • April 2018<br />
This way of measuring exploration expenses has the potential for overestimation, especially<br />
since the data used to calculate them comes from what the firms themselves declare; and the firms<br />
have incentives to inflate them artificially. Unfortunately, this is the only available source of data on<br />
exploration expenses.<br />
(c) Return for copper price volatility<br />
The price of copper has fluctuated widely over the last 45 years, including a strong upswing at the<br />
start of the twenty-first century. This section uses a 45-year series of copper prices spanning 1970-2014,<br />
together with time series tools, to determine a long-term or trend price for copper in 2005-2014.<br />
The aim is to recalculate the GMP-10 mining rent, using a long-term copper price series, from<br />
which the cyclical component has been removed. In other words, the copper prices observed each<br />
year are turned into a smoothed long-term trend series, from which short-term fluctuations have<br />
been eliminated.<br />
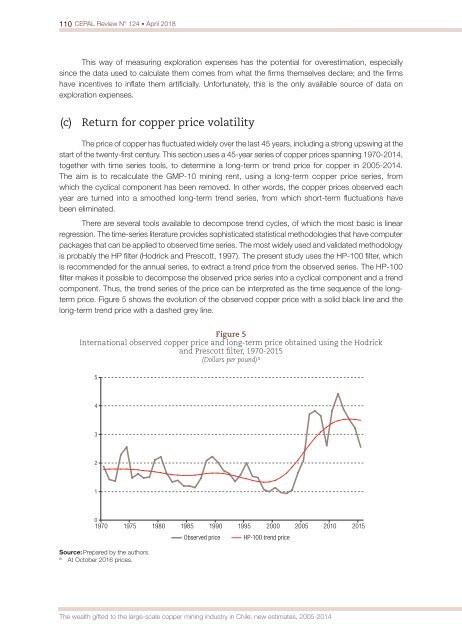
There are several tools available to decompose trend cycles, of which the most basic is linear<br />
regression. The time-series literature provides sophisticated statistical methodologies that have computer<br />
packages that can be applied to observed time series. The most widely used and validated methodology<br />
is probably the HP filter (Hodrick and Prescott, 1997). The present study uses the HP-100 filter, which<br />
is recommended for the annual series, to extract a trend price from the observed series. The HP-100<br />
filter makes it possible to decompose the observed price series into a cyclical component and a trend<br />
component. Thus, the trend series of the price can be interpreted as the time sequence of the longterm<br />
price. Figure 5 shows the evolution of the observed copper price with a solid black line and the<br />
long-term trend price with a dashed grey line.<br />
Figure 5<br />
International observed copper price and long-term price obtained using the Hodrick<br />
and Prescott filter, 1970-2015<br />
(Dollars per pound) a<br />
5<br />
4<br />
3<br />
2<br />
1<br />
0<br />
1970 1975 1980 1985 1990 1995 2000 2005 2010 2015<br />
Source: Prepared by the authors.<br />
a<br />
At October 2016 prices.<br />
Observed price<br />
HP-100 trend price<br />
The wealth gifted to the large-scale copper mining industry in Chile: new estimates, 2005-2014


