
You also want an ePaper? Increase the reach of your titles
YUMPU automatically turns print PDFs into web optimized ePapers that Google loves.
Quantitative PCR for Monitoring CML Patients 87<br />
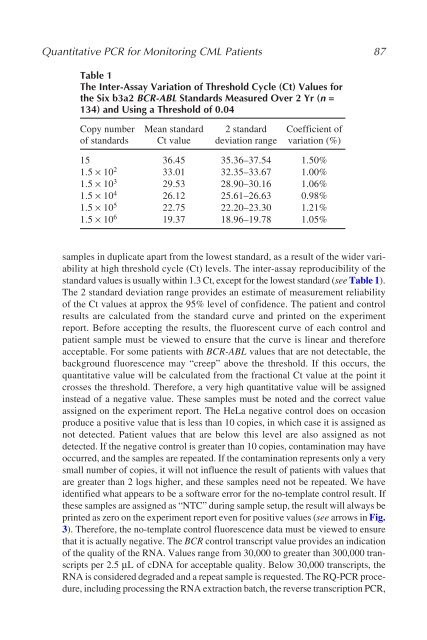
Table 1<br />
The Inter-Assay Variation of Threshold Cycle (Ct) Values for<br />
the Six b3a2 BCR-ABL Standards Measured Over 2 Yr (n =<br />
134) and Using a Threshold of 0.04<br />
Copy number Mean standard 2 standard Coefficient of<br />
of standards Ct value deviation range variation (%)<br />
15 36.45 35.36–37.54 1.50%<br />
1.5 × 10 2 33.01 32.35–33.67 1.00%<br />
1.5 × 10 3 29.53 28.90–30.16 1.06%<br />
1.5 × 10 4 26.12 25.61–26.63 0.98%<br />
1.5 × 10 5 22.75 22.20–23.30 1.21%<br />
1.5 × 10 6 19.37 18.96–19.78 1.05%<br />
samples in duplicate apart from the lowest standard, as a result of the wider variability<br />
at high threshold cycle (Ct) levels. The inter-assay reproducibility of the<br />
standard values is usually within 1.3 Ct, except for the lowest standard (see Table 1).<br />
The 2 standard deviation range provides an estimate of measurement reliability<br />
of the Ct values at approx the 95% level of confidence. The patient and control<br />
results are calculated from the standard curve and printed on the experiment<br />
report. Before accepting the results, the fluorescent curve of each control and<br />
patient sample must be viewed to ensure that the curve is linear and therefore<br />
acceptable. For some patients with BCR-ABL values that are not detectable, the<br />
background fluorescence may “creep” above the threshold. If this occurs, the<br />
quantitative value will be calculated from the fractional Ct value at the point it<br />
crosses the threshold. Therefore, a very high quantitative value will be assigned<br />
instead of a negative value. These samples must be noted and the correct value<br />
assigned on the experiment report. The HeLa negative control does on occasion<br />
produce a positive value that is less than 10 copies, in which case it is assigned as<br />
not detected. Patient values that are below this level are also assigned as not<br />
detected. If the negative control is greater than 10 copies, contamination may have<br />
occurred, and the samples are repeated. If the contamination represents only a very<br />
small number of copies, it will not influence the result of patients with values that<br />
are greater than 2 logs higher, and these samples need not be repeated. We have<br />
identified what appears to be a software error for the no-template control result. If<br />
these samples are assigned as “NTC” during sample setup, the result will always be<br />
printed as zero on the experiment report even for positive values (see arrows in Fig.<br />
3). Therefore, the no-template control fluorescence data must be viewed to ensure<br />
that it is actually negative. The BCR control transcript value provides an indication<br />
of the quality of the RNA. Values range from 30,000 to greater than 300,000 transcripts<br />
per 2.5 µL of cDNA for acceptable quality. Below 30,000 transcripts, the<br />
RNA is considered degraded and a repeat sample is requested. The RQ-PCR procedure,<br />
including processing the RNA extraction batch, the reverse transcription PCR,