
You also want an ePaper? Increase the reach of your titles
YUMPU automatically turns print PDFs into web optimized ePapers that Google loves.
246 Christopherson et al.<br />
4. Each batch of slides is tested with cell lines and/or frozen peripheral blood leukocytes<br />
or leukemia cells of known immunophenotype to check antibody-binding<br />
activities.<br />
3.2. Binding of Leukocytes to the DotScan Microarray<br />
1. The collection of peripheral blood from patients and normal subjects, purification<br />
of mononuclear leukocytes on Histopaque-1077, and their immunophenotyping on<br />
a CD antibody microarray are described by Belov et al. (3,10).<br />
2. Most lymphoid cell suspensions are tested in PBS containing 1 mM ethylenediamine<br />
tetraacetic acid (EDTA), but cells from patients with AML are tested in<br />
PBS, without EDTA, containing heat-inactivated human AB serum (2% (v/v),<br />
Sigma-Aldrich, St. Louis, MO) to minimize nonspecific Fc receptor binding (see<br />
Note 1).<br />
3. Leukocytes (4–6 ⋅ 10 6 cells, see Note 2) suspended in 300 ∝L of PBS plus AB<br />
serum are incubated at room temperature (20°C) for 60 min.<br />
4. Unbound cells are gently washed off with PBS; then the microarrays are fixed for<br />
at least 20 min in PBS containing 3.7% (v/v) formaldehyde, and washed in PBS.<br />
5. Complete instructions on the use of the DotScan microarray are provided with<br />
the kits available from Medsaic Pty. Ltd. (Australian Technology Park, Eveleigh,<br />
Australia).<br />
3.3. Data Recording and Analysis<br />
Dot patterns of leukocytes captured on the DotScan microarray are recorded<br />
using a DotScan array reader and software (see Note 3). The software quantifies<br />
the intensities of each dot from the digital image file and compiles expression<br />
profiles as bar charts showing the average intensities above background<br />
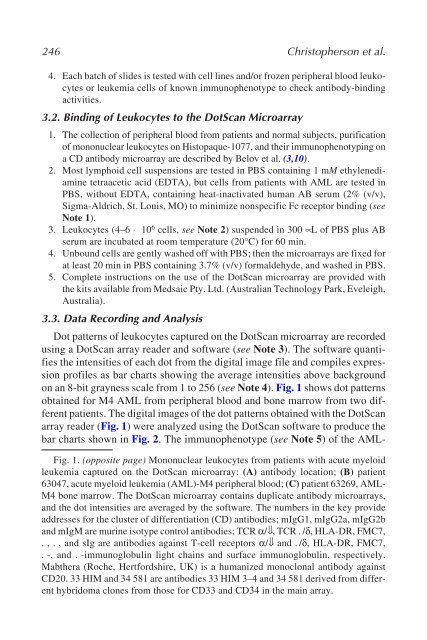
on an 8-bit grayness scale from 1 to 256 (see Note 4). Fig. 1 shows dot patterns<br />
obtained for M4 AML from peripheral blood and bone marrow from two different<br />
patients. The digital images of the dot patterns obtained with the DotScan<br />
array reader (Fig. 1) were analyzed using the DotScan software to produce the<br />
bar charts shown in Fig. 2. The immunophenotype (see Note 5) of the AML-<br />
Fig. 1. (opposite page) Mononuclear leukocytes from patients with acute myeloid<br />
leukemia captured on the DotScan microarray: (A) antibody location; (B) patient<br />
63047, acute myeloid leukemia (AML)-M4 peripheral blood; (C) patient 63269, AML-<br />
M4 bone marrow. The DotScan microarray contains duplicate antibody microarrays,<br />
and the dot intensities are averaged by the software. The numbers in the key provide<br />
addresses for the cluster of differentiation (CD) antibodies; mIgG1, mIgG2a, mIgG2b<br />
and mIgM are murine isotype control antibodies; TCR α/⇓, TCR . /δ, HLA-DR, FMC7,<br />
. , . , and sIg are antibodies against T-cell receptors α/⇓ and . /δ, HLA-DR, FMC7,<br />
. -, and . -immunoglobulin light chains and surface immunoglobulin, respectively.<br />
Mabthera (Roche, Hertfordshire, UK) is a humanized monoclonal antibody against<br />
CD20. 33 HIM and 34 581 are antibodies 33 HIM 3–4 and 34 581 derived from different<br />
hybridoma clones from those for CD33 and CD34 in the main array.