VGB POWERTECH 11 (2019)
VGB PowerTech - International Journal for Generation and Storage of Electricity and Heat. Issue 11 (2019). Technical Journal of the VGB PowerTech Association. Energy is us! Power plant operation: legal & technology. Pumped hydro storage. Latent heat storages.
VGB PowerTech - International Journal for Generation and Storage of Electricity and Heat. Issue 11 (2019).
Technical Journal of the VGB PowerTech Association. Energy is us!
Power plant operation: legal & technology. Pumped hydro storage. Latent heat storages.

You also want an ePaper? Increase the reach of your titles
YUMPU automatically turns print PDFs into web optimized ePapers that Google loves.
<strong>VGB</strong> PowerTech <strong>11</strong> l <strong>2019</strong><br />
Pumped hydro storage as enabler of energy transition<br />
20<br />
60<br />
10<br />
50<br />
PRLO in GW<br />
0<br />
-10<br />
-20<br />
-30<br />
PRLOmax<br />
PRLOmin<br />
Standardabweiung<br />
PRLO<br />
nur PV<br />
nur Wind<br />
Häufigkeit<br />
40<br />
30<br />
20<br />
10<br />
Mi#l1<br />
2016<br />
Mi#l1<br />
2030<br />
Mi#l1<br />
2050<br />
nur Wind+PV<br />
-40<br />
0<br />
-25 -20 -15 -10 -5 0 5 10 15 20<br />
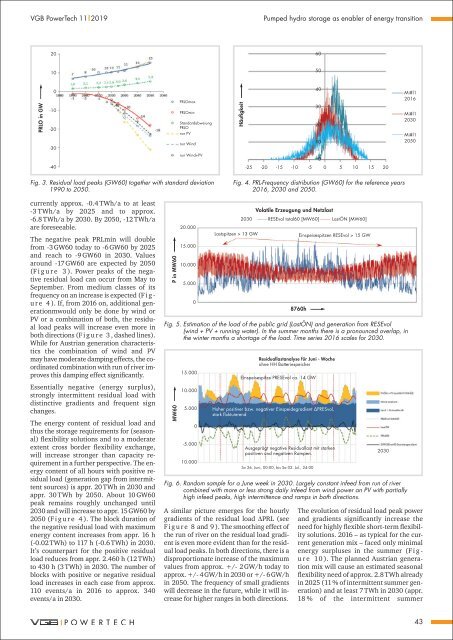
Fig. 3. Residual load peaks (GW60) together with standard deviation<br />
1990 to 2050.<br />
Fig. 4. PRL-Frequency distribution (GW60) for the reference years<br />
2016, 2030 and 2050.<br />
currently approx. -0.4 TWh/a to at least<br />
-3 TWh/a by 2025 and to approx.<br />
-6.8 TWh/a by 2030. By 2050, -12 TWh/a<br />
are foreseeable.<br />
The negative peak PRLmin will double<br />
from -3 GW60 today to -6 GW60 by 2025<br />
and reach to -9 GW60 in 2030. Values<br />
around -17 GW60 are expected by 2050<br />
(F i g u r e 3 ). Power peaks of the negative<br />
residual load can occur from May to<br />
September. From medium classes of its<br />
frequency on an increase is expected (F i g -<br />
u r e 4 ). If, from 2016 on, additional generationmwould<br />
only be done by wind or<br />
PV or a combination of both, the residual<br />
load peaks will increase even more in<br />
both directions (F i g u r e 3 , dashed lines).<br />
While for Austrian generation characteristics<br />
the combination of wind and PV<br />
may have moderate damping effects, the coordinated<br />
combination with run of river improves<br />
this damping effect significantly.<br />
Essentially negative (energy surplus),<br />
strongly intermittent residual load with<br />
distinctive gradients and frequent sign<br />
changes.<br />
The energy content of residual load and<br />
thus the storage requirements for (seasonal)<br />
flexibility solutions and to a moderate<br />
extent cross border flexibility exchange,<br />
will increase stronger than capacity requirement<br />
in a further perspective. The energy<br />
content of all hours with positive residual<br />
load (generation gap from intermittent<br />
sources) is appr. 20 TWh in 2030 and<br />
appr. 30 TWh by 2050. About 10 GW60<br />
peak remains roughly unchanged until<br />
2030 and will increase to appr. 15 GW60 by<br />
2050 (F i g u r e 4 ). The block duration of<br />
the negative residual load with maximum<br />
energy content increases from appr. 16 h<br />
(-0.02 TWh) to <strong>11</strong>7 h (-0.6 TWh) in 2030.<br />
It’s counterpart for the positive residual<br />
load reduces from appr. 2.460 h (12 TWh)<br />
to 430 h (3 TWh) in 2030. The number of<br />
blocks with positive or negative residual<br />
load increases in each case from approx.<br />
<strong>11</strong>0 events/a in 2016 to approx. 340<br />
events/a in 2030.<br />
P in MW60<br />
20.000<br />
15.000<br />
10.000<br />
5.000<br />
0<br />
Lastspitzen > 13 GW<br />
A similar picture emerges for the hourly<br />
gradients of the residual load ∆PRL (see<br />
F i g u r e 8 and 9 ). The smoothing effect of<br />
the run of river on the residual load gradient<br />
is even more evident than for the residual<br />
load peaks. In both directions, there is a<br />
disproportionate increase of the maximum<br />
values from approx. +/- 2 GW/h today to<br />
approx. +/- 4 GW/h in 2030 or +/- 6 GW/h<br />
in 2050. The frequency of small gradients<br />
will decrease in the future, while it will increase<br />
for higher ranges in both directions.<br />
Volatile Erzeugung und Netzlast<br />
2030 RESEvol total60 [MW60] LastÖN [MW60]<br />
8760h<br />
Einspeisespitzen RESEvol > 15 GW<br />
Fig. 5. Estimation of the load of the public grid (LastÖN) and generation from RESEvol<br />
(wind + PV + running water). In the summer months there is a pronounced overlap, in<br />
the winter months a shortage of the load. Time series 2016 scales for 2030.<br />
MW60<br />
15.000<br />
10.000<br />
5.000<br />
0<br />
-5.000<br />
10.000<br />
Residuallastanalyse für Juni - Woche<br />
ohne HH Batteriespeicher<br />
Einspeisespitze PRESEvol ca. 14 GW<br />
Hoher positiver bzw. negativer Einspeidegradient ∆PRESvol,<br />
stark fluktuierend<br />
Ausgeprägt negative Residuallast mit starken<br />
positiven und negativen Rampen.<br />
So 26. Juni, 00:00, bis Sa 02. Jul., 24:00<br />
Fig. 6. Random sample for a June week in 2030. Largely constant infeed from run of river<br />
combined with more or less strong daily infeed from wind power an PV with partially<br />
high infeed peaks, high intermittence and ramps in both directions.<br />
2030<br />
The evolution of residual load peak power<br />
and gradients significantly increase the<br />
need for highly flexible short-term flexibility<br />
solutions. 2016 – as typical for the current<br />
generation mix – faced only minimal<br />
energy surpluses in the summer (F i g -<br />
u r e 10 ). The planned Austrian generation<br />
mix will cause an estimated seasonal<br />
flexibility need of approx. 2.8 TWh already<br />
in 2025 (<strong>11</strong> % of intermittent summer generation)<br />
and at least 7 TWh in 2030 (appr.<br />
18 % of the intermittent summer<br />
43