
You also want an ePaper? Increase the reach of your titles
YUMPU automatically turns print PDFs into web optimized ePapers that Google loves.
<strong>WRF</strong>-VAR<br />
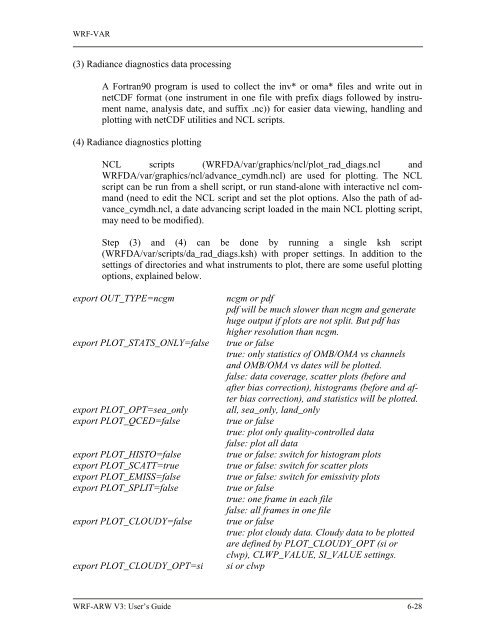
(3) Radiance diagnostics data processing<br />
A Fortran90 program is used to collect the inv* or oma* files and write out in<br />
netCDF format (one instrument in one file with prefix diags followed by instrument<br />
name, analysis date, and suffix .nc)) for easier data viewing, handling and<br />
plotting with netCDF utilities and NCL scripts.<br />
(4) Radiance diagnostics plotting<br />
NCL scripts (<strong>WRF</strong>DA/var/graphics/ncl/plot_rad_diags.ncl and<br />
<strong>WRF</strong>DA/var/graphics/ncl/advance_cymdh.ncl) are used for plotting. The NCL<br />
script can be run from a shell script, or run stand-alone with interactive ncl command<br />
(need to edit the NCL script and set the plot options. Also the path of advance_cymdh.ncl,<br />
a date advancing script loaded in the main NCL plotting script,<br />
may need to be modified).<br />
Step (3) and (4) can be done by running a single ksh script<br />
(<strong>WRF</strong>DA/var/scripts/da_rad_diags.ksh) with proper settings. In addition to the<br />
settings of directories and what instruments to plot, there are some useful plotting<br />
options, explained below.<br />
export OUT_TYPE=ncgm ncgm or pdf<br />
pdf will be much slower than ncgm and generate<br />
huge output if plots are not split. But pdf has<br />
higher resolution than ncgm.<br />
export PLOT_STATS_ONLY=false true or false<br />
true: only statistics of OMB/OMA vs channels<br />
and OMB/OMA vs dates will be plotted.<br />
false: data coverage, scatter plots (before and<br />
after bias correction), histograms (before and after<br />
bias correction), and statistics will be plotted.<br />
export PLOT_OPT=sea_only all, sea_only, land_only<br />
export PLOT_QCED=false true or false<br />
true: plot only quality-controlled data<br />
false: plot all data<br />
export PLOT_HISTO=false true or false: switch for histogram plots<br />
export PLOT_SCATT=true true or false: switch for scatter plots<br />
export PLOT_EMISS=false true or false: switch for emissivity plots<br />
export PLOT_SPLIT=false true or false<br />
true: one frame in each file<br />
false: all frames in one file<br />
export PLOT_CLOUDY=false true or false<br />
true: plot cloudy data. Cloudy data to be plotted<br />
are defined by PLOT_CLOUDY_OPT (si or<br />
clwp), CLWP_VALUE, SI_VALUE settings.<br />
export PLOT_CLOUDY_OPT=si si or clwp<br />
<strong>WRF</strong>-<strong>ARW</strong> V3: User’s <strong>Guide</strong> 6-28