Education Sector Strategic Plan 2004-2015 - Planipolis
Education Sector Strategic Plan 2004-2015 - Planipolis
Education Sector Strategic Plan 2004-2015 - Planipolis

You also want an ePaper? Increase the reach of your titles
YUMPU automatically turns print PDFs into web optimized ePapers that Google loves.
Final ESSP<br />
In order to accommodate the social demand for further education and to better<br />
prepare Ugandans for participation in the global economy, much larger numbers of<br />
students must be admitted to S1. The ESSP provides for the steady growth of the<br />
rate of transition from primary to post-primary schools. The rate of transition from<br />
primary to post-primary is assumed to grow from 46% in <strong>2004</strong> to 80% in 2011.<br />
In 2010, the UPE bulge will enter the tertiary education system. If Ugandan<br />
universities and other tertiary education institutions respond to the increase in the<br />
number of eligible post-primary school leavers, enrolments must increase. The ESSP<br />
projects an increase in tertiary enrolment over the decade of 92.3%, of which 52% is<br />
expected to occur in the final four years of the plan.<br />
Expenditure requirements are driven by primarily by enrolments. The increase in the<br />
education budget can be traced to the growth in numbers of students to be served.<br />
Growth in both absolute and relative budgets closely follows the UPE bulge. The<br />
cost per student of secondary, vocational and tertiary education are much greater -<br />
roughly 3 times more for secondary, 7 times more for vocational, and 55 times more<br />
for tertiary - than for primary education. Therefore, growth in enrolment in the postprimary<br />
and tertiary sub-sectors has a compounded effect on costs. Because of these<br />
developments, the share of total spending for education devoted to the primary subsector<br />
will decline, despite an increase in both per-student and total expenditures on<br />
primary education.<br />
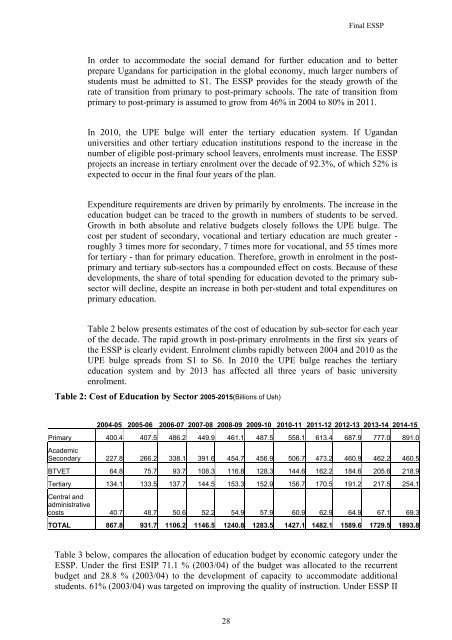
Table 2 below presents estimates of the cost of education by sub-sector for each year<br />
of the decade. The rapid growth in post-primary enrolments in the first six years of<br />
the ESSP is clearly evident. Enrolment climbs rapidly between <strong>2004</strong> and 2010 as the<br />
UPE bulge spreads from S1 to S6. In 2010 the UPE bulge reaches the tertiary<br />
education system and by 2013 has affected all three years of basic university<br />
enrolment.<br />
Table 2: Cost of <strong>Education</strong> by <strong>Sector</strong> 2005-<strong>2015</strong>(Billions of Ush)<br />
<strong>2004</strong>-05 2005-06 2006-07 2007-08 2008-09 2009-10 2010-11 2011-12 2012-13 2013-14 2014-15<br />
Primary 400.4 407.5 486.2 449.9 461.1 487.5 558.1 613.4 687.9 777.0 891.0<br />
Academic<br />
Secondary 227.8 266.2 338.1 391.6 454.7 456.9 506.7 473.2 460.9 462.2 460.5<br />
BTVET 64.8 75.7 93.7 108.3 116.8 128.3 144.6 162.2 184.6 205.6 218.9<br />
Tertiary 134.1 133.5 137.7 144.5 153.3 152.9 156.7 170.5 191.2 217.5 254.1<br />
Central and<br />
administrative<br />
costs 40.7 48.7 50.6 52.2 54.9 57.9 60.9 62.9 64.9 67.1 69.3<br />
TOTAL 867.8 931.7 1106.2 1146.5 1240.8 1283.5 1427.1 1482.1 1589.6 1729.5 1893.8<br />
Table 3 below, compares the allocation of education budget by economic category under the<br />
ESSP. Under the first ESIP 71.1 % (2003/04) of the budget was allocated to the recurrent<br />
budget and 28.8 % (2003/04) to the development of capacity to accommodate additional<br />
students. 61% (2003/04) was targeted on improving the quality of instruction. Under ESSP II<br />
28