Education Sector Strategic Plan 2004-2015 - Planipolis
Education Sector Strategic Plan 2004-2015 - Planipolis
Education Sector Strategic Plan 2004-2015 - Planipolis

Create successful ePaper yourself
Turn your PDF publications into a flip-book with our unique Google optimized e-Paper software.
Primary<br />
Academic Secondary<br />
BTVET<br />
Tertiary (Projected)<br />
TOTAL INSTRUCTIONAL<br />
Central and Administrative Functions<br />
MoES HQ<br />
NCDC (prey under sec dept)<br />
UNEB<br />
Pre-pri. & pri (less instruc. Mat.)<br />
Secondary education dept HQ<br />
Teacher education HQ<br />
Special education - dept<br />
Higher education - (Excl. UPK from FY 03/04)<br />
<strong>Education</strong> <strong>Plan</strong>ning<br />
ESA (o/w 0.375bn FY 03/04)<br />
UVQA<br />
Ed Service Commission<br />
Total Central and Administrative<br />
TOTAL GOVERNMENT<br />
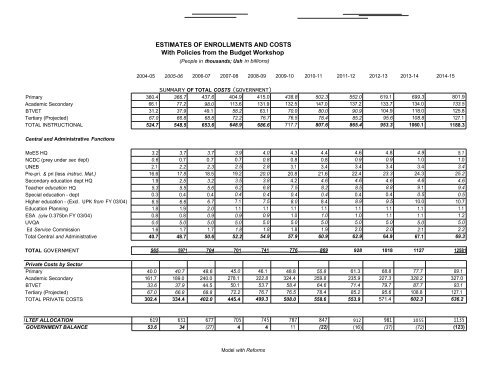
ESTIMATES OF ENROLLMENTS AND COSTS<br />
With Policies from the Budget Workshop<br />
(People in thousands; Ush in billions)<br />
<strong>2004</strong>-05 2005-06 2006-07 2007-08 2008-09 2009-10 2010-11 2011-12 2012-13 2013-14 2014-15<br />
SUMMARY OF TOTAL COSTS (GOVERNMENT)<br />
360.4 366.7 437.6 404.9 415.0 438.8 502.3 552.0 619.1 699.3 801.9<br />
66.1 77.2 98.0 113.6 131.9 132.5 147.0 137.2 133.7 134.0 133.5<br />
31.2 37.9 49.1 58.2 63.1 70.0 80.0 90.9 104.9 118.0 125.8<br />
67.0 66.8 68.8 72.2 76.7 76.5 78.4 85.2 95.6 108.8 127.1<br />
524.7 548.5 653.6 648.9 686.6 717.7 807.6 865.4 953.3 1060.1 1188.3<br />
3.2 3.7 3.7 3.9 4.0 4.3 4.4 4.6 4.8 4.9 5.1<br />
0.6 0.7 0.7 0.7 0.8 0.8 0.8 0.9 0.9 1.0 1.0<br />
2.1 2.2 2.3 2.5 2.8 3.1 3.4 3.4 3.4 3.4 3.4<br />
16.6 17.8 18.5 19.2 20.0 20.8 21.6 22.4 23.3 24.3 25.2<br />
1.9 2.5 3.2 3.5 3.8 4.2 4.6 4.6 4.6 4.6 4.6<br />
5.3 5.5 5.6 6.2 6.8 7.5 8.2 8.5 8.8 9.1 9.4<br />
0.3 0.4 0.4 0.4 0.4 0.4 0.4 0.4 0.4 0.5 0.5<br />
6.5 6.6 6.7 7.1 7.5 8.0 8.4 8.9 9.5 10.0 10.7<br />
1.8 1.9 2.0 1.1 1.1 1.1 1.1 1.1 1.1 1.1 1.1<br />
0.8 0.8 0.9 0.9 0.9 1.0 1.0 1.0 1.1 1.1 1.2<br />
0.0 5.0 5.0 5.0 5.0 5.0 5.0 5.0 5.0 5.0 5.0<br />
1.6 1.7 1.7 1.8 1.8 1.8 1.9 2.0 2.0 2:1 2.2<br />
40.7 48.7 50.6 52.2 54.9 57.9 60.9 62.9 64.9 67.1 69.3<br />
565 5971 704 701 741 776 869 928 1018 1127 12581<br />
Private Costs by <strong>Sector</strong><br />
Primary 40.0 40.7 48.6 45.0 46.1 48.8 55.8 61.3 68.8 77.7 89.1<br />
Academic Secondary 161.7 189.0 240.0 278.1 322.8 324.4 359.8 335.9 327.3 328.2 327.0<br />
BTVET 33.6 37.9 44.5 50.1 53.7 58.4 64.6 71.4 79.7 87.7 93.1<br />
Tertiary (Projected) 67.0 66.8 68.8 72.2 76.7 76.5 78.4 85.2 95.6 108.8 127.1<br />
TOTAL PRIVATE COSTS 302.4 334.4 402.0 445.4 499.3 508.0 558.6 553.9 571.4 602.3 636.2<br />
I LTEF ALLOCATION 619 631 677 705 745 787 847 912 981 1055 1135<br />
GOVERNMENT BALANCE 53.6 34 (27) 4 4 11 (22) (16) (37) (72) (123)<br />
Model with Reforms