Education Sector Strategic Plan 2004-2015 - Planipolis
Education Sector Strategic Plan 2004-2015 - Planipolis
Education Sector Strategic Plan 2004-2015 - Planipolis

Create successful ePaper yourself
Turn your PDF publications into a flip-book with our unique Google optimized e-Paper software.
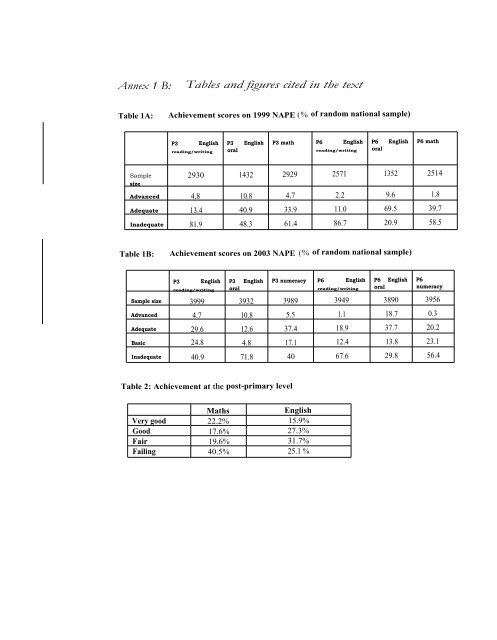
Annex 1 B: Tables and figures cited in the text<br />
Table 1A: Achievement scores on 1999 NAPE (% of random national sample)<br />
Sample<br />
size<br />
P3 English<br />
reading/writing<br />
P3 English<br />
oral<br />
P3 math P6 English<br />
reading/writing<br />
P6 English<br />
oral<br />
P6 math<br />
2930 1432 2929 2571 1352 2514<br />
Advanced 4.8 10.8 4.7 2.2 9.6 1.8<br />
Adequate 13.4 40.9 33.9 11.0 69.5 39.7<br />
Inadequate 81.9 48.3 61.4 86.7 20.9 58.5<br />
Table 1B: Achievement scores on 2003 NAPE (% of random national sample)<br />
P3 English<br />
reading/writing<br />
P3 English<br />
oral<br />
P3 numeracy P6 English<br />
reading/writing<br />
P6 English<br />
oral<br />
P6<br />
numeracy<br />
Sample size 3999 3932 3989 3949 3890 3956<br />
Advanced 4.7 10.8 5.5 1.1 18.7 0.3<br />
Adequate 29.6 12.6 37.4 18.9 37.7 20.2<br />
Basic 24.8 4.8 17.1 12.4 13.8 23.1<br />
Inadequate 40.9 71.8 40 67.6 29.8 56.4<br />
Table 2: Achievement at the post-primary level<br />
Maths English<br />
Very good 22.2% 15.9%<br />
Good 17.6% 27.3%<br />
Fair 19.6% 31.7%<br />
Failing 40.5% 25.1 %