BIOENERGY FOR EUROPE: WHICH ONES FIT BEST?
BIOENERGY FOR EUROPE: WHICH ONES FIT BEST?
BIOENERGY FOR EUROPE: WHICH ONES FIT BEST?

Create successful ePaper yourself
Turn your PDF publications into a flip-book with our unique Google optimized e-Paper software.
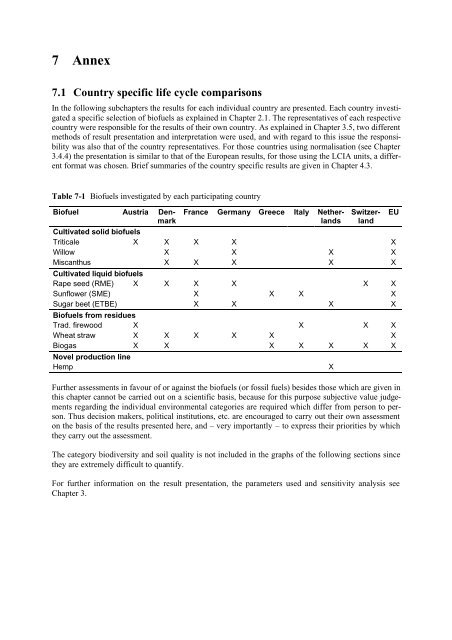
7 Annex<br />
7.1 Country specific life cycle comparisons<br />
In the following subchapters the results for each individual country are presented. Each country investigated<br />
a specific selection of biofuels as explained in Chapter 2.1. The representatives of each respective<br />
country were responsible for the results of their own country. As explained in Chapter 3.5, two different<br />
methods of result presentation and interpretation were used, and with regard to this issue the responsibility<br />
was also that of the country representatives. For those countries using normalisation (see Chapter<br />
3.4.4) the presentation is similar to that of the European results, for those using the LCIA units, a different<br />
format was chosen. Brief summaries of the country specific results are given in Chapter 4.3.<br />
Table 7-1 Biofuels investigated by each participating country<br />
Biofuel Austria Denmark<br />
France Germany Greece Italy Netherlands <br />
Switzerland<br />
Cultivated solid biofuels<br />
Triticale X X X X X<br />
Willow X X X X<br />
Miscanthus X X X X X<br />
Cultivated liquid biofuels<br />
Rape seed (RME) X X X X X X<br />
Sunflower (SME) X X X X<br />
Sugar beet (ETBE) X X X X<br />
Biofuels from residues<br />
Trad. firewood X X X X<br />
Wheat straw X X X X X X<br />
Biogas X X X X X X X<br />
Novel production line<br />
Hemp X<br />
Further assessments in favour of or against the biofuels (or fossil fuels) besides those which are given in<br />
this chapter cannot be carried out on a scientific basis, because for this purpose subjective value judgements<br />
regarding the individual environmental categories are required which differ from person to person.<br />
Thus decision makers, political institutions, etc. are encouraged to carry out their own assessment<br />
on the basis of the results presented here, and – very importantly – to express their priorities by which<br />
they carry out the assessment.<br />
The category biodiversity and soil quality is not included in the graphs of the following sections since<br />
they are extremely difficult to quantify.<br />
For further information on the result presentation, the parameters used and sensitivity analysis see<br />
Chapter 3.<br />
EU