BIOENERGY FOR EUROPE: WHICH ONES FIT BEST?
BIOENERGY FOR EUROPE: WHICH ONES FIT BEST?
BIOENERGY FOR EUROPE: WHICH ONES FIT BEST?

You also want an ePaper? Increase the reach of your titles
YUMPU automatically turns print PDFs into web optimized ePapers that Google loves.
42 3 Life cycle assessment of biofuels: methods and tools<br />
The values for the human toxicity category tend to be rather uncertain. The reason for this is that it<br />
is extremely difficult to obtain reliable input data (emission and characterisation factors) for all toxicity<br />
parameters of relevance. Furthermore, within the scientific community the methodology on the assessment<br />
of toxicity is still being discussed.<br />
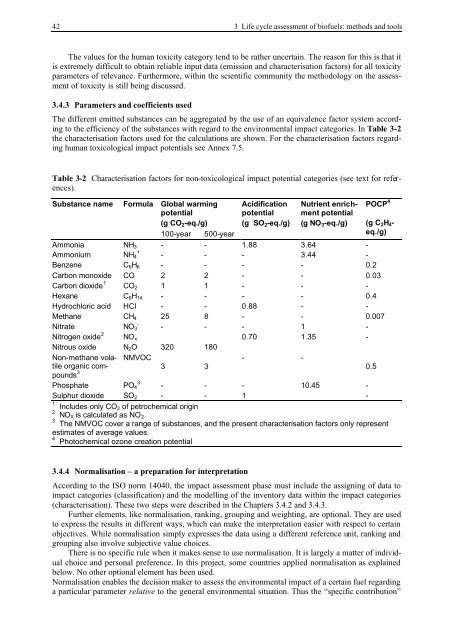
3.4.3 Parameters and coefficients used<br />
The different emitted substances can be aggregated by the use of an equivalence factor system according<br />
to the efficiency of the substances with regard to the environmental impact categories. In Table 3-2<br />
the characterisation factors used for the calculations are shown. For the characterisation factors regarding<br />
human toxicological impact potentials see Annex 7.5.<br />
Table 3-2 Characterisation factors for non-toxicological impact potential categories (see text for references).<br />
Substance name Formula<br />
Global warming<br />
potential<br />
(g CO2-eq./g)<br />
100-year 500-year<br />
Acidification<br />
potential<br />
(g SO2-eq./g)<br />
Nutrient enrichment<br />
potential<br />
(g NO3-eq./g)<br />
POCP 4<br />
(g C2H4eq./g)<br />
Ammonia NH3 - - 1.88 3.64 -<br />
Ammonium NH4 + - - - 3.44 -<br />
Benzene C6H6 - - - - 0.2<br />
Carbon monoxide CO 2 2 - - 0.03<br />
Carbon dioxide 1 CO2 1 1 - - -<br />
Hexane<br />
C6H14 - - - - 0.4<br />
Hydrochloric acid HCl - - 0.88 - -<br />
Methane CH4 25 8 - - 0.007<br />
Nitrate NO3 - - - - 1 -<br />
Nitrogen oxide 2<br />
NOx 0.70 1.35 -<br />
Nitrous oxide N2O 320 180<br />
Non-methane vola- NMVOC<br />
- -<br />
tile organic com-<br />
3 3<br />
0.5<br />
pounds 3<br />
Phosphate PO4 3- - - - 10.45 -<br />
Sulphur dioxide SO2 - - 1 -<br />
1<br />
Includes only CO2 of petrochemical origin<br />
2<br />
NOX is calculated as NO2.<br />
3<br />
The NMVOC cover a range of substances, and the present characterisation factors only represent<br />
estimates of average values.<br />
4 Photochemical ozone creation potential<br />
3.4.4 Normalisation – a preparation for interpretation<br />
According to the ISO norm 14040, the impact assessment phase must include the assigning of data to<br />
impact categories (classification) and the modelling of the inventory data within the impact categories<br />
(characterisation). These two steps were described in the Chapters 3.4.2 and 3.4.3.<br />
Further elements, like normalisation, ranking, grouping and weighting, are optional. They are used<br />
to express the results in different ways, which can make the interpretation easier with respect to certain<br />
objectives. While normalisation simply expresses the data using a different reference unit, ranking and<br />
grouping also involve subjective value choices.<br />
There is no specific rule when it makes sense to use normalisation. It is largely a matter of individual<br />
choice and personal preference. In this project, some countries applied normalisation as explained<br />
below. No other optional element has been used.<br />
Normalisation enables the decision maker to assess the environmental impact of a certain fuel regarding<br />
a particular parameter relative to the general environmental situation. Thus the “specific contribution”