BIOENERGY FOR EUROPE: WHICH ONES FIT BEST?
BIOENERGY FOR EUROPE: WHICH ONES FIT BEST?
BIOENERGY FOR EUROPE: WHICH ONES FIT BEST?

You also want an ePaper? Increase the reach of your titles
YUMPU automatically turns print PDFs into web optimized ePapers that Google loves.
5.2 Socio-economic aspects 81<br />
ple is the time consumption of soil preparation, which is highest and therefore most expensive in various<br />
crops in the Netherlands and in Switzerland.<br />
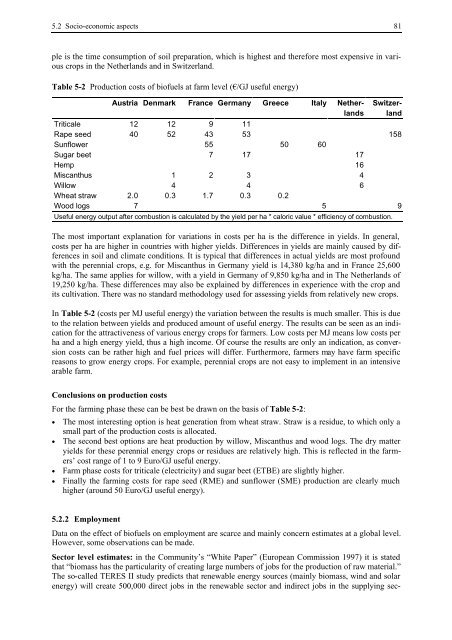
Table 5-2 Production costs of biofuels at farm level (€/GJ useful energy)<br />
Austria Denmark France Germany Greece Italy Nether- Switzer-<br />
lands land<br />
Triticale 12 12 9 11<br />
Rape seed 40 52 43 53 158<br />
Sunflower 55 50 60<br />
Sugar beet 7 17 17<br />
Hemp 16<br />
Miscanthus 1 2 3 4<br />
Willow 4 4 6<br />
Wheat straw 2.0 0.3 1.7 0.3 0.2<br />
Wood logs 7 5 9<br />
Useful energy output after combustion is calculated by the yield per ha * caloric value * efficiency of combustion.<br />
The most important explanation for variations in costs per ha is the difference in yields. In general,<br />
costs per ha are higher in countries with higher yields. Differences in yields are mainly caused by differences<br />
in soil and climate conditions. It is typical that differences in actual yields are most profound<br />
with the perennial crops, e.g. for Miscanthus in Germany yield is 14,380 kg/ha and in France 25,600<br />
kg/ha. The same applies for willow, with a yield in Germany of 9,850 kg/ha and in The Netherlands of<br />
19,250 kg/ha. These differences may also be explained by differences in experience with the crop and<br />
its cultivation. There was no standard methodology used for assessing yields from relatively new crops.<br />
In Table 5-2 (costs per MJ useful energy) the variation between the results is much smaller. This is due<br />
to the relation between yields and produced amount of useful energy. The results can be seen as an indication<br />
for the attractiveness of various energy crops for farmers. Low costs per MJ means low costs per<br />
ha and a high energy yield, thus a high income. Of course the results are only an indication, as conversion<br />
costs can be rather high and fuel prices will differ. Furthermore, farmers may have farm specific<br />
reasons to grow energy crops. For example, perennial crops are not easy to implement in an intensive<br />
arable farm.<br />
Conclusions on production costs<br />
For the farming phase these can be best be drawn on the basis of Table 5-2:<br />
• The most interesting option is heat generation from wheat straw. Straw is a residue, to which only a<br />
small part of the production costs is allocated.<br />
• The second best options are heat production by willow, Miscanthus and wood logs. The dry matter<br />
yields for these perennial energy crops or residues are relatively high. This is reflected in the farmers’<br />
cost range of 1 to 9 Euro/GJ useful energy.<br />
• Farm phase costs for triticale (electricity) and sugar beet (ETBE) are slightly higher.<br />
• Finally the farming costs for rape seed (RME) and sunflower (SME) production are clearly much<br />
higher (around 50 Euro/GJ useful energy).<br />
5.2.2 Employment<br />
Data on the effect of biofuels on employment are scarce and mainly concern estimates at a global level.<br />
However, some observations can be made.<br />
Sector level estimates: in the Community’s “White Paper” (European Commission 1997) it is stated<br />
that “biomass has the particularity of creating large numbers of jobs for the production of raw material.”<br />
The so-called TERES II study predicts that renewable energy sources (mainly biomass, wind and solar<br />
energy) will create 500,000 direct jobs in the renewable sector and indirect jobs in the supplying sec-