BIOENERGY FOR EUROPE: WHICH ONES FIT BEST?
BIOENERGY FOR EUROPE: WHICH ONES FIT BEST?
BIOENERGY FOR EUROPE: WHICH ONES FIT BEST?

You also want an ePaper? Increase the reach of your titles
YUMPU automatically turns print PDFs into web optimized ePapers that Google loves.
90 6 Conclusions and recommendations<br />
Regarding the categories for which reliable values were obtained, the results are summarised below (see<br />
also Table 6-1). The full results are given in the Chapters 4.1 (for Europe) and 7.1 (for each country).<br />
The main conclusions are generally similar between the various countries and Europe:<br />
Use of fossil fuels: all biofuels have, to a greater or lesser extent, advantages over their fossil equivalents<br />
regarding this category. This is due to the fact that through the production and use of biofuels the<br />
utilisation of fossil fuels is reduced.<br />
Greenhouse effect: this factor is causally connected to the use of fossil fuels (which leads to the emission<br />
of greenhouse gasses) and therefore gives very similar results, i. e. always to the advantage of the<br />
biofuels.<br />
Acidification: most biofuels show disadvantages for this category as well, with the exception of triticale<br />
and traditional firewood.<br />
Eutrophication: again the biofuels compare unfavourably against their fossil equivalents. The only<br />
exceptions are RME and SME in certain countries, which receive credits for co-products that make up<br />
for the impacts caused by the biofuel production and utilisation. The large differences for the cultivated<br />
crops are due to the utilisation of fertiliser and its inevitable partial escape into water bodies.<br />
Summer smog: most biofuels have (relatively small) advantages over the fossil fuels, with the exception<br />
of the transport fuels where the results cannot be regarded as significant.<br />
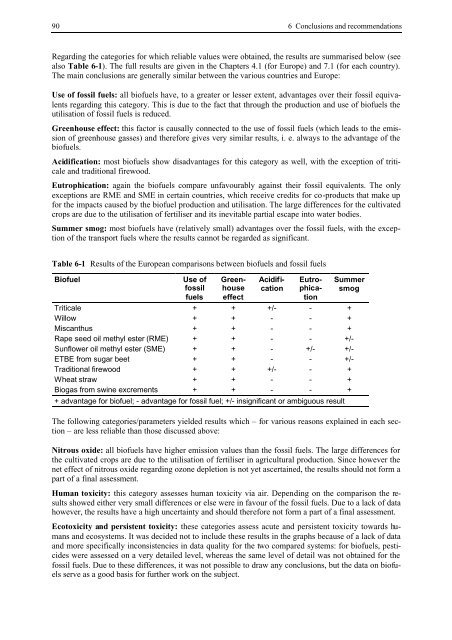
Table 6-1 Results of the European comparisons between biofuels and fossil fuels<br />
Biofuel Use of<br />
fossil<br />
fuels<br />
Greenhouse<br />
effect<br />
Acidification <br />
Eutrophication<br />
Summer<br />
smog<br />
Triticale + + +/- - +<br />
Willow + + - - +<br />
Miscanthus + + - - +<br />
Rape seed oil methyl ester (RME) + + - - +/-<br />
Sunflower oil methyl ester (SME) + + - +/- +/-<br />
ETBE from sugar beet + + - - +/-<br />
Traditional firewood + + +/- - +<br />
Wheat straw + + - - +<br />
Biogas from swine excrements + + - - +<br />
+ advantage for biofuel; - advantage for fossil fuel; +/- insignificant or ambiguous result<br />
The following categories/parameters yielded results which – for various reasons explained in each section<br />
– are less reliable than those discussed above:<br />
Nitrous oxide: all biofuels have higher emission values than the fossil fuels. The large differences for<br />
the cultivated crops are due to the utilisation of fertiliser in agricultural production. Since however the<br />
net effect of nitrous oxide regarding ozone depletion is not yet ascertained, the results should not form a<br />
part of a final assessment.<br />
Human toxicity: this category assesses human toxicity via air. Depending on the comparison the results<br />
showed either very small differences or else were in favour of the fossil fuels. Due to a lack of data<br />
however, the results have a high uncertainty and should therefore not form a part of a final assessment.<br />
Ecotoxicity and persistent toxicity: these categories assess acute and persistent toxicity towards humans<br />
and ecosystems. It was decided not to include these results in the graphs because of a lack of data<br />
and more specifically inconsistencies in data quality for the two compared systems: for biofuels, pesticides<br />
were assessed on a very detailed level, whereas the same level of detail was not obtained for the<br />
fossil fuels. Due to these differences, it was not possible to draw any conclusions, but the data on biofuels<br />
serve as a good basis for further work on the subject.