BIOENERGY FOR EUROPE: WHICH ONES FIT BEST?
BIOENERGY FOR EUROPE: WHICH ONES FIT BEST?
BIOENERGY FOR EUROPE: WHICH ONES FIT BEST?

Create successful ePaper yourself
Turn your PDF publications into a flip-book with our unique Google optimized e-Paper software.
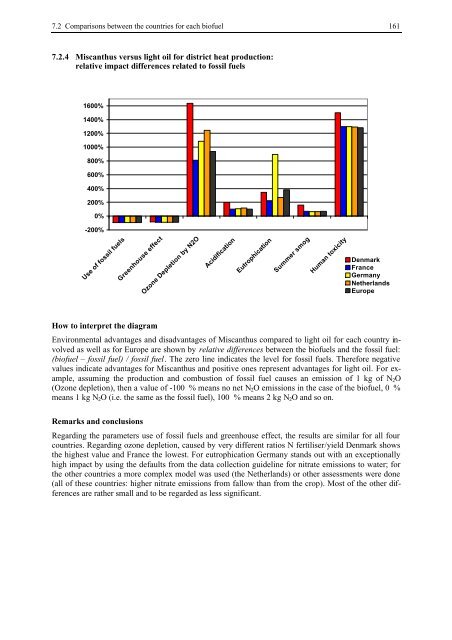
7.2 Comparisons between the countries for each biofuel 161<br />
7.2.4 Miscanthus versus light oil for district heat production:<br />
relative impact differences related to fossil fuels<br />
1600%<br />
1400%<br />
1200%<br />
1000%<br />
800%<br />
600%<br />
400%<br />
200%<br />
0%<br />
-200%<br />
Use of fossil fuels<br />
Greenhouse effect<br />
How to interpret the diagram<br />
Ozone Depletion by N2O<br />
Acidification<br />
Eutrophication<br />
Summer smog<br />
Human toxicity<br />
Denmark<br />
France<br />
Germany<br />
Netherlands<br />
Europe<br />
Environmental advantages and disadvantages of Miscanthus compared to light oil for each country involved<br />
as well as for Europe are shown by relative differences between the biofuels and the fossil fuel:<br />
(biofuel – fossil fuel) / fossil fuel. The zero line indicates the level for fossil fuels. Therefore negative<br />
values indicate advantages for Miscanthus and positive ones represent advantages for light oil. For example,<br />
assuming the production and combustion of fossil fuel causes an emission of 1 kg of N2O<br />
(Ozone depletion), then a value of -100 % means no net N2O emissions in the case of the biofuel, 0 %<br />
means 1 kg N2O (i.e. the same as the fossil fuel), 100 % means 2 kg N2O and so on.<br />
Remarks and conclusions<br />
Regarding the parameters use of fossil fuels and greenhouse effect, the results are similar for all four<br />
countries. Regarding ozone depletion, caused by very different ratios N fertiliser/yield Denmark shows<br />
the highest value and France the lowest. For eutrophication Germany stands out with an exceptionally<br />
high impact by using the defaults from the data collection guideline for nitrate emissions to water; for<br />
the other countries a more complex model was used (the Netherlands) or other assessments were done<br />
(all of these countries: higher nitrate emissions from fallow than from the crop). Most of the other differences<br />
are rather small and to be regarded as less significant.