BIOENERGY FOR EUROPE: WHICH ONES FIT BEST?
BIOENERGY FOR EUROPE: WHICH ONES FIT BEST?
BIOENERGY FOR EUROPE: WHICH ONES FIT BEST?

Create successful ePaper yourself
Turn your PDF publications into a flip-book with our unique Google optimized e-Paper software.
4.1 Introduction 49<br />
case excluding them. Credits are given for the agricultural reference system (for details see the next<br />
paragraph), rape seed meal, and glycerine. The result of this comparison indicates that significant differences<br />
may result. This shows firstly that it is necessary to include the co-products adequately in the<br />
life cycle analyses (in accordance with the principle “from cradle to grave”) as it is done here. Secondly,<br />
the results presented here may only be interpreted in the light of the system boundaries (and<br />
credits considered) used within this study.<br />
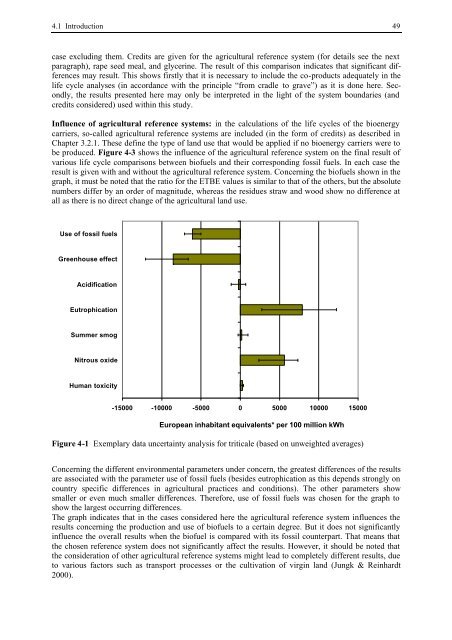
Influence of agricultural reference systems: in the calculations of the life cycles of the bioenergy<br />
carriers, so-called agricultural reference systems are included (in the form of credits) as described in<br />
Chapter 3.2.1. These define the type of land use that would be applied if no bioenergy carriers were to<br />
be produced. Figure 4-3 shows the influence of the agricultural reference system on the final result of<br />
various life cycle comparisons between biofuels and their corresponding fossil fuels. In each case the<br />
result is given with and without the agricultural reference system. Concerning the biofuels shown in the<br />
graph, it must be noted that the ratio for the ETBE values is similar to that of the others, but the absolute<br />
numbers differ by an order of magnitude, whereas the residues straw and wood show no difference at<br />
all as there is no direct change of the agricultural land use.<br />
Use of fossil fuels<br />
Greenhouse effect<br />
Acidification<br />
Eutrophication<br />
Summer smog<br />
Nitrous oxide<br />
Human toxicity<br />
-15000 -10000 -5000 0 5000 10000 15000<br />
European inhabitant equivalents* per 100 million kWh<br />
Figure 4-1 Exemplary data uncertainty analysis for triticale (based on unweighted averages)<br />
Concerning the different environmental parameters under concern, the greatest differences of the results<br />
are associated with the parameter use of fossil fuels (besides eutrophication as this depends strongly on<br />
country specific differences in agricultural practices and conditions). The other parameters show<br />
smaller or even much smaller differences. Therefore, use of fossil fuels was chosen for the graph to<br />
show the largest occurring differences.<br />
The graph indicates that in the cases considered here the agricultural reference system influences the<br />
results concerning the production and use of biofuels to a certain degree. But it does not significantly<br />
influence the overall results when the biofuel is compared with its fossil counterpart. That means that<br />
the chosen reference system does not significantly affect the results. However, it should be noted that<br />
the consideration of other agricultural reference systems might lead to completely different results, due<br />
to various factors such as transport processes or the cultivation of virgin land (Jungk & Reinhardt<br />
2000).