BIOENERGY FOR EUROPE: WHICH ONES FIT BEST?
BIOENERGY FOR EUROPE: WHICH ONES FIT BEST?
BIOENERGY FOR EUROPE: WHICH ONES FIT BEST?

You also want an ePaper? Increase the reach of your titles
YUMPU automatically turns print PDFs into web optimized ePapers that Google loves.
160 7 Annex<br />
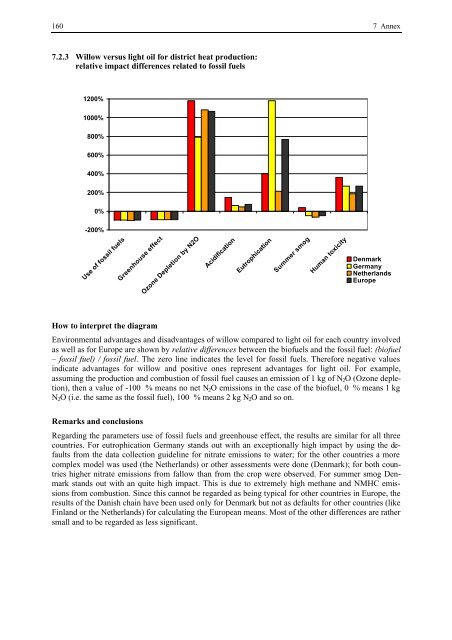
7.2.3 Willow versus light oil for district heat production:<br />
relative impact differences related to fossil fuels<br />
1200%<br />
1000%<br />
800%<br />
600%<br />
400%<br />
200%<br />
0%<br />
-200%<br />
Use of fossil fuels<br />
Greenhouse effect<br />
How to interpret the diagram<br />
Ozone Depletion by N2O<br />
Acidification<br />
Eutrophication<br />
Summer smog<br />
Human toxicity<br />
Denmark<br />
Germany<br />
Netherlands<br />
Europe<br />
Environmental advantages and disadvantages of willow compared to light oil for each country involved<br />
as well as for Europe are shown by relative differences between the biofuels and the fossil fuel: (biofuel<br />
– fossil fuel) / fossil fuel. The zero line indicates the level for fossil fuels. Therefore negative values<br />
indicate advantages for willow and positive ones represent advantages for light oil. For example,<br />
assuming the production and combustion of fossil fuel causes an emission of 1 kg of N2O (Ozone depletion),<br />
then a value of -100 % means no net N2O emissions in the case of the biofuel, 0 % means 1 kg<br />
N2O (i.e. the same as the fossil fuel), 100 % means 2 kg N2O and so on.<br />
Remarks and conclusions<br />
Regarding the parameters use of fossil fuels and greenhouse effect, the results are similar for all three<br />
countries. For eutrophication Germany stands out with an exceptionally high impact by using the defaults<br />
from the data collection guideline for nitrate emissions to water; for the other countries a more<br />
complex model was used (the Netherlands) or other assessments were done (Denmark); for both countries<br />
higher nitrate emissions from fallow than from the crop were observed. For summer smog Denmark<br />
stands out with an quite high impact. This is due to extremely high methane and NMHC emissions<br />
from combustion. Since this cannot be regarded as being typical for other countries in Europe, the<br />
results of the Danish chain have been used only for Denmark but not as defaults for other countries (like<br />
Finland or the Netherlands) for calculating the European means. Most of the other differences are rather<br />
small and to be regarded as less significant.