Plan Estratégico para Princz - Catálogo de la UCA
Plan Estratégico para Princz - Catálogo de la UCA
Plan Estratégico para Princz - Catálogo de la UCA

Create successful ePaper yourself
Turn your PDF publications into a flip-book with our unique Google optimized e-Paper software.
16<br />
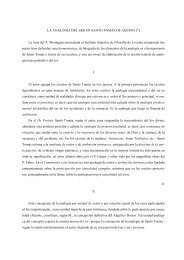
POLÍMEROS TERMOPLÁSTICOS<br />
Origen <strong>de</strong> <strong>la</strong>s Importaciones<br />
En Tone<strong>la</strong>das, Año 1998<br />
España<br />
1,8%<br />
Alemaña<br />
3,6%<br />
Japon<br />
1,8%<br />
Taiwan<br />
1,6% Belgica<br />
1,6%<br />
Otros<br />
11,3%<br />
Brasil<br />
38,2%<br />
Corea<br />
<strong>de</strong>l Sur<br />
4%<br />
Mexico<br />
9,8%<br />
EEUU<br />
26,3%<br />
Base: 596.189 tone<strong>la</strong>das<br />
Fuente: CLAVES, con información <strong>de</strong> CAIP e INDEC<br />
Cerca <strong>de</strong>l 25% <strong>de</strong> <strong>la</strong>s importaciones <strong>de</strong> Polímeros Termoplásticos<br />
correspondientes al año 1998 estuvo integrado por PEBD, con lo cual<br />
dicho producto se constituyó en el principal ítem <strong>de</strong> importación <strong>de</strong>l<br />
sector.<br />
Sin embargo, el segmento <strong>de</strong> mayor crecimiento en materia <strong>de</strong><br />
importaciones fue el <strong>de</strong>l PET, habiéndose multiplicado <strong>la</strong>s mismas en 19,3<br />
veces durante dicho período, con lo cual logró constituirse en el segundo<br />
producto <strong>de</strong> importación <strong>de</strong>l sector. Las importaciones <strong>de</strong> los restantes<br />
segmentos termoplásticos experimentaron incrementos que osci<strong>la</strong>ron entre<br />
el 108% y el 199%.<br />
POLÍMEROS TERMOPLÁSTICOS<br />
Evolución Com<strong>para</strong>tiva <strong>de</strong> <strong>la</strong>s Importaciones por Segmento, en Tone<strong>la</strong>das<br />
Segmento 1992 1993 1994 1995 1996 1997 1998<br />
Var.<br />
98/97<br />
Polietileno baja<br />
<strong>de</strong>nsidad<br />
30.471 59.548 80.764 75.271 95.443 146.656 146.603 0,0% 24,59%<br />
Polietileno alta<br />
<strong>de</strong>nsidad<br />
33.696 57.109 60.418 48.950 72.660 100.450 100.719 0,3% 16,89%<br />
PVC 29.779 43.937 47.531 36.271 51.892 62.057 70.223 13,2% 11,78%<br />
Polipropileno 12.123 14.989 16.651 14.524 14.454 22.822 25.554 12,0% 4,29%<br />
Poliestireno 4.300 4.938 3.002 2.789 6.027 6.914 8.922 29,0% 1,50%<br />
PET 6.470 11.400 17.832 45.248 69.302 98.399 124.844 26,9% 20,94%<br />
Otros<br />
Termoplásticos<br />
54.727 56.824 59.656 64.340 81.856 100.650 119.324 18,6% 20,01%<br />
Total<br />
Termoplásticos<br />
Part.<br />
%<br />
171.566 248.745 285.854 287.393 391.634 537.948 596.189 10,8% 100%<br />
Fuente: CLAVES, con información <strong>de</strong> CAIP e INDEC