- Page 1: 05Informe anualGrupo ACScrecemos pe
- Page 6 and 7: Órganosde DirecciónConsejode Admi
- Page 8 and 9: Comité de DirecciónPresidenciaPre
- Page 10 and 11: Equipo DirectivoACS, Actividades de
- Page 12 and 13: EstrategiaCorporativaVisiónUna ref
- Page 14 and 15: PrincipalesCifras del Grupo ACSMill
- Page 16 and 17: 1Informede Actividades
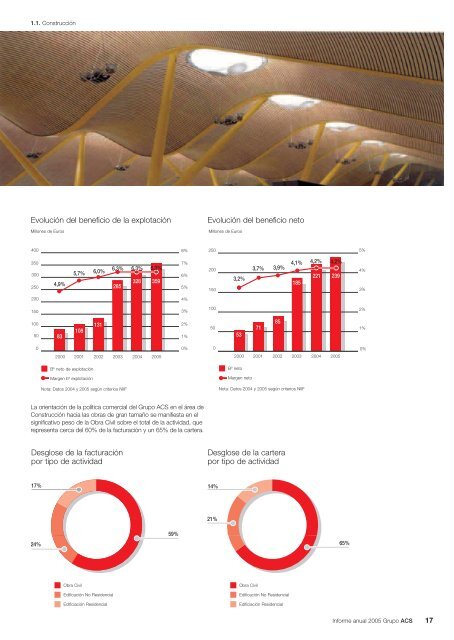
- Page 20 and 21: En la actividad de Obra Civil el Gr
- Page 22 and 23: Obra civilLa licitación oficial ha
- Page 24 and 25: EdificaciónLa edificación tambié
- Page 26 and 27: Estructura organizativaConstrucció
- Page 29 and 30: 1.1. Construcción• Remodelación
- Page 31 and 32: 1.1. ConstrucciónAdjudicaciones en
- Page 33 and 34: 1.2. Servicios IndustrialesEvoluci
- Page 35 and 36: 1.2. Servicios Industriales- Proyec
- Page 37 and 38: 1.2. Servicios IndustrialesEstructu
- Page 39 and 40: 1.2. Servicios Industriales• Come
- Page 41 and 42: 1.2. Servicios IndustrialesEn proye
- Page 43 and 44: 1.2. Servicios IndustrialesDesglose
- Page 45 and 46: 1.3. Servicios y ConcesionesEvoluci
- Page 47 and 48: 1.3. Servicios y ConcesionesPerspec
- Page 49 and 50: 1.3. Servicios y ConcesionesEstruct
- Page 51 and 52: 1.3. Servicios y Concesiones• Lim
- Page 53 and 54: 1.3. Servicios y Concesiones1.3.2.
- Page 55 and 56: 1.3. Servicios y ConcesionesRespect
- Page 57 and 58: 1.4. Participaciones EstratégicasC
- Page 59 and 60: Informe anual 2005 Grupo ACS57
- Page 61 and 62: 2.1 Informe de Gestión del Grupo C
- Page 63 and 64: 2.1. Informe de Gestión del Grupo
- Page 65 and 66: 2.1. Informe de Gestión del Grupo
- Page 67 and 68: 2.1. Informe de Gestión del Grupo
- Page 69 and 70:
2.1. Informe de Gestión del Grupo
- Page 71 and 72:
2.1. Informe de Gestión del Grupo
- Page 73 and 74:
2.1. Informe de Gestión del Grupo
- Page 75 and 76:
2.1. Informe de Gestión del Grupo
- Page 77 and 78:
2.1. Informe de Gestión del Grupo
- Page 79 and 80:
2.2. Cuentas Anuales del Grupo Cons
- Page 81 and 82:
2.2. Cuentas Anuales del Grupo Cons
- Page 83 and 84:
2.2. Cuentas Anuales del Grupo Cons
- Page 85 and 86:
2.2. Cuentas Anuales del Grupo Cons
- Page 87 and 88:
2.2. Cuentas Anuales del Grupo Cons
- Page 89 and 90:
2.2. Cuentas Anuales del Grupo Cons
- Page 91 and 92:
2.2. Cuentas Anuales del Grupo Cons
- Page 93 and 94:
2.2. Cuentas Anuales del Grupo Cons
- Page 95 and 96:
2.2. Cuentas Anuales del Grupo Cons
- Page 97 and 98:
2.2. Cuentas Anuales del Grupo Cons
- Page 99 and 100:
2.2. Cuentas Anuales del Grupo Cons
- Page 101 and 102:
2.2. Cuentas Anuales del Grupo Cons
- Page 103 and 104:
2.2. Cuentas Anuales del Grupo Cons
- Page 105 and 106:
2.2. Cuentas Anuales del Grupo Cons
- Page 107 and 108:
2.2. Cuentas Anuales del Grupo Cons
- Page 109 and 110:
2.2. Cuentas Anuales del Grupo Cons
- Page 111 and 112:
2.2. Cuentas Anuales del Grupo Cons
- Page 113 and 114:
2.2. Cuentas Anuales del Grupo Cons
- Page 115 and 116:
2.2. Cuentas Anuales del Grupo Cons
- Page 117 and 118:
2.2. Cuentas Anuales del Grupo Cons
- Page 119 and 120:
2.2. Cuentas Anuales del Grupo Cons
- Page 121 and 122:
2.2. Cuentas Anuales del Grupo Cons
- Page 123 and 124:
2.2. Cuentas Anuales del Grupo Cons
- Page 125 and 126:
2.2. Cuentas Anuales del Grupo Cons
- Page 127 and 128:
2.2. Cuentas Anuales del Grupo Cons
- Page 129 and 130:
2.2. Cuentas Anuales del Grupo Cons
- Page 131 and 132:
2.2. Cuentas Anuales del Grupo Cons
- Page 133 and 134:
2.2. Cuentas Anuales del Grupo Cons
- Page 135 and 136:
2.2. Cuentas Anuales del Grupo Cons
- Page 137 and 138:
2.2. Cuentas Anuales del Grupo Cons
- Page 139 and 140:
2.2. Cuentas Anuales del Grupo Cons
- Page 141 and 142:
2.2. Cuentas Anuales del Grupo Cons
- Page 143 and 144:
2.2. Cuentas Anuales del Grupo Cons
- Page 145 and 146:
2.2. Cuentas Anuales del Grupo Cons
- Page 147 and 148:
2.2. Cuentas Anuales del Grupo Cons
- Page 149 and 150:
2.2. Cuentas Anuales del Grupo Cons
- Page 151 and 152:
2.2. Cuentas Anuales del Grupo Cons
- Page 153 and 154:
2.2. Cuentas Anuales del Grupo Cons
- Page 155 and 156:
2.2. Cuentas Anuales del Grupo Cons
- Page 157 and 158:
2.2. Cuentas Anuales del Grupo Cons
- Page 159 and 160:
2.2. Cuentas Anuales del Grupo Cons
- Page 161 and 162:
2.2. Cuentas Anuales del Grupo Cons
- Page 163 and 164:
2.2. Cuentas Anuales del Grupo Cons
- Page 165 and 166:
2.2. Cuentas Anuales del Grupo Cons
- Page 167 and 168:
2.2. Cuentas Anuales del Grupo Cons
- Page 169 and 170:
2.2. Cuentas Anuales del Grupo Cons
- Page 171 and 172:
2.2. Cuentas Anuales del Grupo Cons
- Page 173 and 174:
2.2. Cuentas Anuales del Grupo Cons
- Page 175 and 176:
2.2. Cuentas Anuales del Grupo Cons
- Page 177 and 178:
2.3. Informe de Auditoría del Grup
- Page 179 and 180:
3InformedeResponsabilidadCorporativ
- Page 181 and 182:
3.1El Grupo ACS yla Responsabilidad
- Page 183 and 184:
3.2Compromiso conla Creación de Va
- Page 185 and 186:
Valor paralos clientesEl Grupo ACS
- Page 187 and 188:
Valor paralos accionistasEl Grupo A
- Page 189 and 190:
Valor paralos empleadosDistribució
- Page 191 and 192:
3.3Compromiso con laTransparencia I
- Page 193 and 194:
La comunicación ytransparencia hac
- Page 195 and 196:
ConstrucciónDurante el año 2005 l
- Page 197 and 198:
Caso PrácticoObras Subterráneas:
- Page 199 and 200:
Caso PrácticoDragados Offshore,
- Page 201 and 202:
Caso Práctico“Investigación par
- Page 203 and 204:
3.5Compromiso conel Entorno Natural
- Page 205 and 206:
ConstrucciónPrincipales ImpactosGe
- Page 207 and 208:
Caso PrácticoNuevo puerto exterior
- Page 209 and 210:
Prescripciones Afecciones obras Med
- Page 211 and 212:
Servicios IndustrialesPrincipales I
- Page 213 and 214:
Servicios y ConcesionesDistrubució
- Page 215 and 216:
El Grupo ACS es responsable del sum
- Page 217 and 218:
3.6Compromiso conlas Personas y el
- Page 219 and 220:
Políticas de formacióny desarroll
- Page 221 and 222:
Políticas de seguridady prevenció
- Page 223 and 224:
Compromisocon la sociedadCada año,
- Page 225 and 226:
Dentro del trabajo de la Fundación
- Page 227 and 228:
• III Premio “Desarrollo Sosten
- Page 229 and 230:
Compromiso conlas Naciones UnidasEl
- Page 231 and 232:
Háganos llegarsu opiniónComo ha p
- Page 233 and 234:
4Informede Gobierno Corporativo
- Page 235 and 236:
AEstructurade la PropiedadA.1. Comp
- Page 237 and 238:
A.5. Indique, en su caso, las relac
- Page 239 and 240:
BEstructura de la Administraciónde
- Page 241 and 242:
B.1.4. Indique si la calificación
- Page 243 and 244:
c) Remuneración total por tipolog
- Page 245 and 246:
B.1.13. Indique, en su caso, las mo
- Page 247 and 248:
B.1.20. Indique si los estatutos o
- Page 249 and 250:
B.1.30. Indique el número de años
- Page 251 and 252:
B.2.2. Detalle todas las comisiones
- Page 253 and 254:
B.2.4. Indique, en su caso, las fac
- Page 255 and 256:
C.5. Detalle los mecanismos estable
- Page 257 and 258:
DSistemas deControl de RiesgosD.1.
- Page 259 and 260:
La gestión del riesgo de variacion
- Page 261 and 262:
3. Información financiera.El Grupo
- Page 263 and 264:
Estatutos Sociales se recoge expres
- Page 265 and 266:
FGrado de seguimiento de lasrecomen
- Page 267 and 268:
Recomendación 7.- Composición Com
- Page 269 and 270:
Sin perjuicio de lo anterior, el ar
- Page 271 and 272:
Las sociedades IBERPISTAS, S.A.C.E.
- Page 273 and 274:
AnexosPrincipales indicadoresde com
- Page 275 and 276:
DirectorioOficinas centrales de las
- Page 277 and 278:
ACS, Actividadesde Construcción y
- Page 279:
EdiciónGrupo ACSCreación y diseñ