- Page 1 and 2:
S E R I E S CULTURE & TERRITORY NEI
- Page 3 and 4:
Imprint CyberParks - Fostering know
- Page 5 and 6:
3 Neighbourhood & City - Between di
- Page 7 and 8:
Part II - Enhancing the understandi
- Page 9 and 10:
FOREWORD Neighbourhood & City - Bet
- Page 11 and 12:
In its own way, each chapter comes
- Page 13 and 14:
promoting sustainable urban mobilit
- Page 15 and 16:
elationship teenagers build with th
- Page 17 and 18:
APRESENTAÇÃO Bairro & Cidade - En
- Page 19 and 20:
sem, contudo, deixar de presenciar
- Page 21 and 22:
Continuando no Mediterrâneo, nomea
- Page 23 and 24:
adaptada conceção dos espaços p
- Page 25 and 26:
PART ONE REFLECTING THE URBAN SPACE
- Page 27 and 28:
Neighbourhood & City Digital in act
- Page 29 and 30:
Neighbourhood & City of the alterna
- Page 31 and 32:
Neighbourhood & City between 2012 a
- Page 33 and 34:
Neighbourhood & City sense, the Int
- Page 35 and 36:
Neighbourhood & City considered a
- Page 37 and 38:
Neighbourhood & City Gentrificaçã
- Page 39 and 40:
Neighbourhood & City A rede serve p
- Page 41 and 42:
Neighbourhood & City fluxos que aí
- Page 43 and 44:
Neighbourhood & City deste capítul
- Page 45 and 46:
Neighbourhood & City Em Lisboa, por
- Page 47 and 48:
Neighbourhood & City REFERÊNCIAS B
- Page 49 and 50:
Neighbourhood & City Reflections on
- Page 51 and 52:
Neighbourhood & City the urban envi
- Page 53 and 54:
Neighbourhood & City promotes a hol
- Page 55 and 56:
Neighbourhood & City REASONING THE
- Page 57 and 58:
Neighbourhood & City practice devel
- Page 59 and 60:
Neighbourhood & City Congress of th
- Page 61 and 62:
Neighbourhood & City Learning in hy
- Page 63 and 64:
Neighbourhood & City Fig. 1: Key-te
- Page 65 and 66:
Neighbourhood & City TECHNOLOGICAL
- Page 67 and 68:
Neighbourhood & City to learn every
- Page 69 and 70:
Neighbourhood & City Kim, B. H. & O
- Page 71 and 72:
Neighbourhood & City Exploring visu
- Page 73 and 74:
Neighbourhood & City the majority o
- Page 75 and 76:
Neighbourhood & City in the images,
- Page 77 and 78:
Neighbourhood & City two distinct f
- Page 79 and 80:
Neighbourhood & City Film and Multi
- Page 81 and 82:
Neighbourhood & City Though discuss
- Page 83 and 84:
Neighbourhood & City Hybrid heritag
- Page 85 and 86:
Neighbourhood & City documented con
- Page 87 and 88:
Neighbourhood & City environment wi
- Page 89 and 90:
Neighbourhood & City and digital te
- Page 91 and 92:
Neighbourhood & City Fig. 5: CyI’
- Page 93 and 94:
Neighbourhood & City and research i
- Page 95 and 96:
Neighbourhood & City to streamline
- Page 97 and 98:
Neighbourhood & City Training Schoo
- Page 99 and 100:
Neighbourhood & City Capacity build
- Page 101 and 102:
Neighbourhood & City 99 Fig. 1: Map
- Page 103 and 104:
Neighbourhood & City participation,
- Page 105 and 106:
Neighbourhood & City Identify and e
- Page 107 and 108:
Neighbourhood & City 105 Fig. 3:
- Page 109 and 110:
Neighbourhood & City REFERENCES Asm
- Page 111 and 112:
Neighbourhood & City The role of su
- Page 113 and 114:
Neighbourhood & City walking and vi
- Page 115 and 116:
Neighbourhood & City member states
- Page 117 and 118:
Neighbourhood & City - The central
- Page 119 and 120:
Neighbourhood & City ANALYSIS OF TH
- Page 121 and 122:
Neighbourhood & City infrastructure
- Page 123 and 124:
Neighbourhood & City of the best pe
- Page 125 and 126:
Neighbourhood & City A luta pelo di
- Page 127 and 128:
Neighbourhood & City mídia do paí
- Page 129 and 130:
Neighbourhood & City sua maioria po
- Page 131 and 132:
Neighbourhood & City expansão acel
- Page 133 and 134:
Neighbourhood & City e a vegetaçã
- Page 135 and 136:
Neighbourhood & City auto examinar,
- Page 137 and 138:
PART TWO ENHANCING THE UNDERSTANDIN
- Page 139 and 140:
Neighbourhood & City O acesso ao es
- Page 141 and 142:
Neighbourhood & City sujeitas a ada
- Page 143 and 144:
Neighbourhood & City mente e cumula
- Page 145 and 146:
Neighbourhood & City estudo sobre o
- Page 147 and 148:
Neighbourhood & City 2007). A falta
- Page 149 and 150:
Neighbourhood & City ambiente prop
- Page 151 and 152:
Neighbourhood & City REFERÊNCIAS B
- Page 153 and 154:
Neighbourhood & City Construindo um
- Page 155 and 156:
Neighbourhood & City não-estatais
- Page 157 and 158:
Neighbourhood & City Fig. 1: Nível
- Page 159 and 160:
Neighbourhood & City Qualquer dos d
- Page 161 and 162:
Neighbourhood & City imagem de guet
- Page 163 and 164:
Neighbourhood & City mesmo sobre o
- Page 165 and 166:
Neighbourhood & City INH e da próp
- Page 167 and 168:
Neighbourhood & City Kundera, M. (1
- Page 169 and 170:
Neighbourhood & City Fostering biod
- Page 171 and 172:
Neighbourhood & City Fig. 1: A typi
- Page 173 and 174:
Neighbourhood & City and what measu
- Page 175 and 176:
Neighbourhood & City and nature con
- Page 177 and 178:
Neighbourhood & City Fig. 4: Roofsc
- Page 179 and 180:
Neighbourhood & City Changing the m
- Page 181 and 182:
Neighbourhood & City Example: Hanno
- Page 183 and 184:
Neighbourhood & City and thus restr
- Page 185 and 186:
Neighbourhood & City LHH - Landesha
- Page 187 and 188:
Neighbourhood & City Caught between
- Page 189 and 190:
Neighbourhood & City neighbouring t
- Page 191 and 192:
Neighbourhood & City of the collect
- Page 193 and 194:
Neighbourhood & City parts of the c
- Page 195 and 196:
Neighbourhood & City houses, sample
- Page 197 and 198:
Neighbourhood & City Although gover
- Page 199 and 200:
Neighbourhood & City Mumbai Metropo
- Page 201 and 202:
Neighbourhood & City Intervenções
- Page 203 and 204:
Neighbourhood & City que se apresen
- Page 205 and 206:
Neighbourhood & City Geográfico Ci
- Page 207 and 208:
Neighbourhood & City da ciclomobili
- Page 209 and 210:
Neighbourhood & City prostitutas, u
- Page 211 and 212:
Neighbourhood & City Saara: espaço
- Page 213 and 214:
Neighbourhood & City ções e notí
- Page 215 and 216:
Neighbourhood & City da cidade, atr
- Page 217 and 218:
Neighbourhood & City FORMAS DE SOCI
- Page 219 and 220:
Neighbourhood & City programa dos m
- Page 221 and 222:
Neighbourhood & City se em defesa d
- Page 223 and 224:
Neighbourhood & City Apontamento em
- Page 225 and 226:
Neighbourhood & City 1. Parte de um
- Page 227 and 228:
Neighbourhood & City menos abastada
- Page 229 and 230:
Neighbourhood & City A seguir à in
- Page 231 and 232:
Neighbourhood & City fácil, mesmo
- Page 233 and 234:
Neighbourhood & City alguns dos nov
- Page 235 and 236:
Neighbourhood & City fragmentação
- Page 237 and 238:
Neighbourhood & City Copacabana - a
- Page 239 and 240:
Neighbourhood & City a exemplo do q
- Page 241 and 242:
Neighbourhood & City “Hotel ou ap
- Page 243 and 244:
Neighbourhood & City ocupados por
- Page 245 and 246:
Neighbourhood & City Copacabana ia
- Page 247 and 248:
Neighbourhood & City este novo modo
- Page 249 and 250:
Neighbourhood & City Após os anos
- Page 251 and 252:
Neighbourhood & City Como vejo o me
- Page 253 and 254:
Neighbourhood & City a observação
- Page 255 and 256:
Neighbourhood & City permitiram con
- Page 257 and 258:
Neighbourhood & City ambulante e co
- Page 259 and 260:
Neighbourhood & City Favelas e cond
- Page 261 and 262:
Neighbourhood & City intervencionad
- Page 263 and 264:
Neighbourhood & City Duarte Rosas G
- Page 265 and 266:
Neighbourhood & City Between divers
- Page 267 and 268:
Neighbourhood & City Antonio Berni
- Page 269 and 270:
Neighbourhood & City CULTURE CULTS
- Page 271 and 272:
Neighbourhood & City towards a symb
- Page 273 and 274:
Neighbourhood & City dispossessed?
- Page 275 and 276:
Neighbourhood & City Favela, cité,
- Page 277 and 278:
Neighbourhood & City e funcional, d
- Page 279 and 280:
Neighbourhood & City Lagoa Rodrigo
- Page 281 and 282:
Neighbourhood & City No caso franc
- Page 283 and 284:
Neighbourhood & City disponibilizad
- Page 285 and 286:
Neighbourhood & City Certeau, M. de
- Page 287 and 288:
Neighbourhood & City O moderno como
- Page 289 and 290:
Neighbourhood & City O Congresso de
- Page 291 and 292:
Neighbourhood & City Fig. 1: Vista
- Page 293 and 294:
Neighbourhood & City Fig. 4: (1954)
- Page 295 and 296: Neighbourhood & City Fig. 8: (1954)
- Page 297 and 298: Neighbourhood & City A postura no q
- Page 299 and 300: Neighbourhood & City como as ativid
- Page 301 and 302: Neighbourhood & City PART THREE NEW
- Page 303 and 304: Neighbourhood & City A study on the
- Page 305 and 306: Neighbourhood & City Nevertheless,
- Page 307 and 308: Neighbourhood & City benefit planni
- Page 309 and 310: Neighbourhood & City REFERENCES Bar
- Page 311 and 312: Neighbourhood & City Understanding
- Page 313 and 314: Neighbourhood & City - How citizens
- Page 315 and 316: Neighbourhood & City complexity of
- Page 317 and 318: Neighbourhood & City ethnographic a
- Page 319 and 320: Neighbourhood & City approaches, te
- Page 321 and 322: Neighbourhood & City O papel das no
- Page 323 and 324: Neighbourhood & City O ESPAÇO PÚB
- Page 325 and 326: Neighbourhood & City comportarem um
- Page 327 and 328: Neighbourhood & City local e a func
- Page 329 and 330: Neighbourhood & City projetados par
- Page 331 and 332: Neighbourhood & City O estudo da mo
- Page 333 and 334: Neighbourhood & City Lefebvre (1968
- Page 335 and 336: Neighbourhood & City Deste modo, ca
- Page 337 and 338: Neighbourhood & City - Conhecimento
- Page 339 and 340: Neighbourhood & City Figura 2: Flux
- Page 341 and 342: Neighbourhood & City Figura 6: Mapa
- Page 343 and 344: Neighbourhood & City The Digital Di
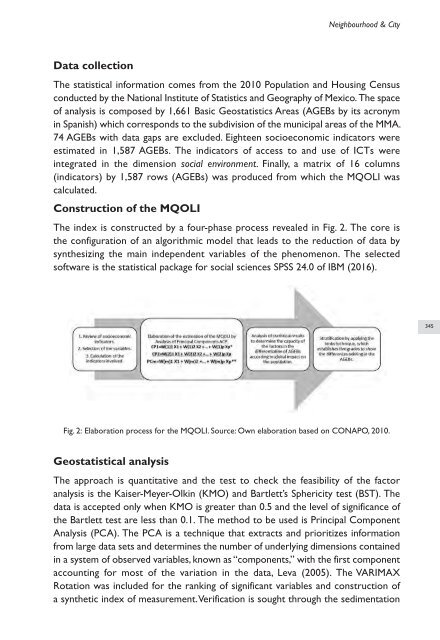
- Page 345: Neighbourhood & City The measured c
- Page 349 and 350: Neighbourhood & City From the origi
- Page 351 and 352: Neighbourhood & City TABLE 4. STRAT
- Page 353 and 354: Neighbourhood & City influence the
- Page 355 and 356: Neighbourhood & City DESAL (1969).
- Page 357 and 358: Neighbourhood & City Analysing trad
- Page 359 and 360: Neighbourhood & City from 1996 to 2
- Page 361 and 362: Neighbourhood & City factors (agric
- Page 363 and 364: Neighbourhood & City TABLE 2: EXTER
- Page 365 and 366: Neighbourhood & City the water shar
- Page 367 and 368: Neighbourhood & City O espaço púb
- Page 369 and 370: Neighbourhood & City A RELAÇÃO EN
- Page 371 and 372: Neighbourhood & City sem a pressão
- Page 373 and 374: Neighbourhood & City Seguidamente,
- Page 375 and 376: Neighbourhood & City que 1 seria po
- Page 377 and 378: Neighbourhood & City se sintam mais
- Page 379 and 380: Neighbourhood & City O ordenamento
- Page 381 and 382: Neighbourhood & City económicas e
- Page 383 and 384: Neighbourhood & City sentido de con
- Page 385 and 386: Neighbourhood & City estratégico e
- Page 387 and 388: Neighbourhood & City de ordenamento
- Page 389 and 390: Neighbourhood & City A importância
- Page 391 and 392: Neighbourhood & City homem e a nece
- Page 393 and 394: Neighbourhood & City a ficha do reg
- Page 395 and 396: Neighbourhood & City PROBLEMÁTICA
- Page 397 and 398:
Neighbourhood & City Fig. 5: Sobrep
- Page 399 and 400:
Neighbourhood & City Alvará de Lot
- Page 401 and 402:
Neighbourhood & City Public spaces
- Page 403 and 404:
Neighbourhood & City people who liv
- Page 405 and 406:
Neighbourhood & City “´(…) cre
- Page 407 and 408:
Neighbourhood & City to strengthen
- Page 409 and 410:
Neighbourhood & City NOTES ON CONTR
- Page 411 and 412:
Neighbourhood & City Elsa ESTRELA i
- Page 413 and 414:
Neighbourhood & City Technology. Hi
- Page 415 and 416:
Neighbourhood & City (Portugal). Sh
- Page 417 and 418:
Coleções do Centro de Estudos Int