- Page 1 and 2:
Guide to STN Patent Databases Basic
- Page 3 and 4:
Preface Guide to STN Patent Databas
- Page 5 and 6:
Guide to STN Patent Databases 8.2 B
- Page 7 and 8:
Guide to STN Patent Databases 22.2
- Page 9:
Guide to STN Patent Databases 37.5
- Page 12 and 13:
12 Guide to STN Patent Databases 1
- Page 14 and 15:
14 Guide to STN Patent Databases 2
- Page 16 and 17:
16 Guide to STN Patent Databases 3.
- Page 18 and 19:
3.3 Fulltext files Databases Type o
- Page 20 and 21:
20 Guide to STN Patent Databases 3.
- Page 22 and 23:
22 Guide to STN Patent Databases 3.
- Page 24 and 25:
24 Guide to STN Patent Databases 4
- Page 26 and 27:
26 1st publication 2nd publication
- Page 28 and 29:
28 Guide to STN Patent Databases EC
- Page 30 and 31:
30 Guide to STN Patent Databases EC
- Page 32 and 33:
32 Guide to STN Patent Databases 6
- Page 34 and 35:
34 Guide to STN Patent Databases Co
- Page 36 and 37:
6.4 Dynamics 36 Guide to STN Patent
- Page 38 and 39:
38 Guide to STN Patent Databases TE
- Page 40 and 41:
7 EPFULL 7.1 Typical queries 40 Gui
- Page 42 and 43:
42 Guide to STN Patent Databases Ro
- Page 44 and 45:
44 Guide to STN Patent Databases 03
- Page 46 and 47:
46 Guide to STN Patent Databases 20
- Page 48 and 49:
48 Guide to STN Patent Databases De
- Page 50 and 51:
8.6.2 Granted Patent Display format
- Page 52 and 53:
52 Guide to STN Patent Databases US
- Page 54 and 55:
9.3 Contents 54 Guide to STN Patent
- Page 56 and 57:
56 Guide to STN Patent Databases AS
- Page 58 and 59:
58 Guide to STN Patent Databases DE
- Page 60 and 61:
DE 69426379 D1 20010111 DE 69426379
- Page 62 and 63:
62 Guide to STN Patent Databases 2
- Page 64 and 65:
10.6 Documents from JAPIO 10.6.1 PA
- Page 66 and 67:
11 PATDPA 11.1 Typical queries 66 G
- Page 68 and 69:
68 Abstract, main claim: Guide to S
- Page 70 and 71:
70 Guide to STN Patent Databases PI
- Page 72 and 73:
12 PATDPAFULL 12.1 Typical queries
- Page 74 and 75:
74 Guide to STN Patent Databases da
- Page 76 and 77:
76 Guide to STN Patent Databases 8.
- Page 78 and 79:
78 Guide to STN Patent Databases OA
- Page 80 and 81:
80 Guide to STN Patent Databases [0
- Page 82 and 83:
82 Guide to STN Patent Databases Pa
- Page 84 and 85:
15 USPATFULL / USPAT2 15.1 Typical
- Page 86 and 87:
86 Guide to STN Patent Databases RA
- Page 88 and 89:
88 Guide to STN Patent Databases RA
- Page 90 and 91:
16 Search by subject 90 Guide to ST
- Page 92 and 93:
17.2 Contents of the Basic Index 92
- Page 94 and 95:
94 Guide to STN Patent Databases lo
- Page 96 and 97:
96 Guide to STN Patent Databases in
- Page 98 and 99:
98 Guide to STN Patent Databases RE
- Page 100 and 101:
100 Guide to STN Patent Databases =
- Page 102 and 103:
102 Guide to STN Patent Databases I
- Page 104 and 105:
104 Guide to STN Patent Databases D
- Page 106 and 107:
A printed IPC code is according to
- Page 108 and 109:
108 Guide to STN Patent Databases F
- Page 110 and 111:
18.3.4 Search Strategy 110 Guide to
- Page 112 and 113:
112 Guide to STN Patent Databases H
- Page 114 and 115:
114 Guide to STN Patent Databases 1
- Page 116 and 117:
19.3.1 Semantic enrichment 116 Guid
- Page 118 and 119:
118 Guide to STN Patent Databases D
- Page 120 and 121:
120 Guide to STN Patent Databases F
- Page 122 and 123:
122 Guide to STN Patent Databases T
- Page 124 and 125:
124 Guide to STN Patent Databases C
- Page 126 and 127:
126 Guide to STN Patent Databases W
- Page 128 and 129:
128 Guide to STN Patent Databases E
- Page 130 and 131:
20.7.4 USPATFULL, USPAT2, USPATOLD
- Page 132 and 133:
21.2 Search by country 132 Guide to
- Page 134 and 135:
134 Guide to STN Patent Databases I
- Page 136 and 137:
136 Guide to STN Patent Databases F
- Page 138 and 139:
138 Guide to STN Patent Databases P
- Page 140 and 141:
21.6 Search by patent kind code 140
- Page 142 and 143:
22 Family search 22.1 Typical famil
- Page 144 and 145:
144 Guide to STN Patent Databases 2
- Page 146 and 147:
146 Guide to STN Patent Databases 2
- Page 148 and 149:
22.4.1.2 148 Guide to STN Patent Da
- Page 150 and 151:
22.5 Family searches on STN 22.5.1
- Page 152 and 153: 152 Guide to STN Patent Databases S
- Page 154 and 155: 154 .F complete family Guide to STN
- Page 156 and 157: 156 Guide to STN Patent Databases W
- Page 158 and 159: 158 Guide to STN Patent Databases U
- Page 160 and 161: 160 Guide to STN Patent Databases A
- Page 162 and 163: 162 Guide to STN Patent Databases F
- Page 164 and 165: 164 Guide to STN Patent Databases E
- Page 166 and 167: 166 Guide to STN Patent Databases F
- Page 168 and 169: These fields are available: 168 Gui
- Page 170 and 171: 170 Guide to STN Patent Databases 2
- Page 172 and 173: 172 Guide to STN Patent Databases L
- Page 174 and 175: 174 Guide to STN Patent Databases P
- Page 176 and 177: 176 Guide to STN Patent Databases L
- Page 178 and 179: 178 Guide to STN Patent Databases P
- Page 180 and 181: 180 Guide to STN Patent Databases 2
- Page 182 and 183: 26 Full text 26.1 Searches in full-
- Page 184 and 185: 26.3 STN Viewer 184 Guide to STN Pa
- Page 186 and 187: 186 Guide to STN Patent Databases L
- Page 188 and 189: 188 Guide to STN Patent Databases T
- Page 190 and 191: 27.3.2 Editing an ANALYZE result 19
- Page 192 and 193: 27.4 SELECT or ANALYZE? 192 Guide t
- Page 194 and 195: 194 Guide to STN Patent Databases 1
- Page 196 and 197: 27.6 Using STN Express STN Express
- Page 198 and 199: 198 Guide to STN Patent Databases T
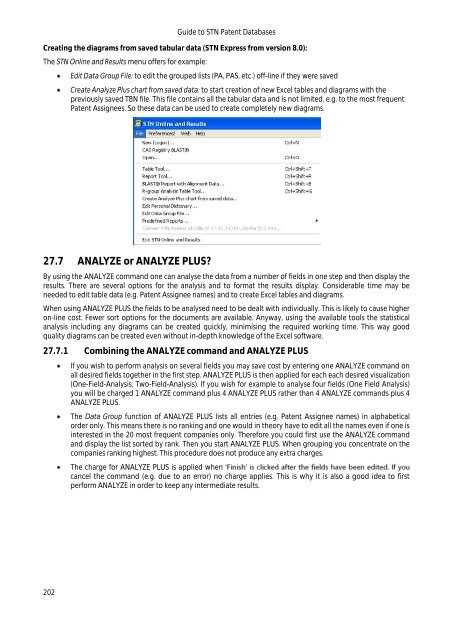
- Page 200 and 201: 200 Guide to STN Patent Databases O
- Page 204 and 205: 27.8.3 ANALYZE PLUS 204 Guide to ST
- Page 206 and 207: 28.3 The SDI command 206 Guide to S
- Page 208 and 209: 208 Guide to STN Patent Databases T
- Page 210 and 211: 210 Guide to STN Patent Databases D
- Page 212 and 213: 212 Guide to STN Patent Databases D
- Page 214 and 215: 214 Guide to STN Patent Databases a
- Page 216 and 217: 216 Guide to STN Patent Databases -
- Page 218 and 219: 218 Guide to STN Patent Databases D
- Page 220 and 221: 220 Guide to STN Patent Databases T
- Page 223 and 224: Search examples 223
- Page 225 and 226: Search examples 29.1.3 Linking clas
- Page 227 and 228: => S L1 AND L2 L16 471 L1 AND L2 =>
- Page 229 and 230: Search examples 29.1.6.1 Command fi
- Page 231 and 232: Search examples E6 5080 NT2 W06-A03
- Page 233 and 234: => S ?GOLF? L3 36542 ?GOLF? Search
- Page 235 and 236: Search examples 30 Example for subj
- Page 237 and 238: Search examples 30.3 Identifying re
- Page 239 and 240: Search examples 31 Numeric Property
- Page 241 and 242: Search examples 32 Search by name (
- Page 243 and 244: Search examples TI (A1) Anordnung e
- Page 245 and 246: Search examples => S (ADAMEK(S)WOLF
- Page 247 and 248: 33.1.2 Search in DWPI => FIL WPINDE
- Page 249 and 250: => D 1- L2 ANALYZE L1 1- PA : 54 TE
- Page 251 and 252: E100 1 HAARMANN REIMER GBMH/PAS ...
- Page 253 and 254:
Search examples DEF KODAK LTD DEF K
- Page 255 and 256:
=> S L5 AND P/DT 5818845 P/DT L6 62
- Page 257 and 258:
34 Family search example 34.1 Searc
- Page 259 and 260:
Search examples L1 ANSWER 1 OF 1 IN
- Page 261 and 262:
FDT US 6300146 B1 Div ex US 6137165
- Page 263 and 264:
SET COMMAND COMPLETED Search exampl
- Page 265 and 266:
Search examples LEGAL STATUS AN 213
- Page 267 and 268:
Search examples CHG Change of Owner
- Page 269 and 270:
Search examples FIA DE 1997-1973075
- Page 271 and 272:
PI US 6514314 B2 20030204 Search ex
- Page 273 and 274:
Search examples TERM # # OCC # DOC
- Page 275 and 276:
Search examples 36 Monitoring searc
- Page 277 and 278:
2. Setting up the SDI: Search examp
- Page 279 and 280:
+--------------PI--------------+ EP
- Page 281 and 282:
=> D PFAM 1- FFAMED b) Set-up of an
- Page 283 and 284:
Search examples => S (DE11200500240
- Page 285 and 286:
Search examples LEGAL STATUS HIT AN
- Page 287 and 288:
36.2 Chemical Abstracts Search exam
- Page 289 and 290:
Search examples IT Information syst
- Page 291 and 292:
Search examples Some documents have
- Page 293 and 294:
SET SMARTSELECT OFF SET COMMAND COM
- Page 295 and 296:
Search examples L5 ANSWER 3 OF 123
- Page 297 and 298:
Search examples => FIL PATDPAFULL,
- Page 299 and 300:
Search examples HCAPLUS 1 BIOLIX/PA
- Page 301 and 302:
FILE 'IMSPATENTS' 0 COLGATE/PA 0 PA
- Page 303 and 304:
27 PALMOLIVE/PA 27 (COLGATE (S) PAL
- Page 305:
185 CN100347190 C/PNK 186 CN1003513
- Page 308 and 309:
308 Guide to STN Patent Databases 3
- Page 310 and 311:
310 Guide to STN Patent Databases C
- Page 312 and 313:
312 Guide to STN Patent Databases K
- Page 314 and 315:
314 Unexamined applications Singapo
- Page 316 and 317:
316 Patent applications from Januar
- Page 318 and 319:
41 Number formats (Publication numb
- Page 320 and 321:
Type of publication Printed publica
- Page 322:
Type of publication Printed publica