FRANCE The
FRANCE The
FRANCE The

You also want an ePaper? Increase the reach of your titles
YUMPU automatically turns print PDFs into web optimized ePapers that Google loves.
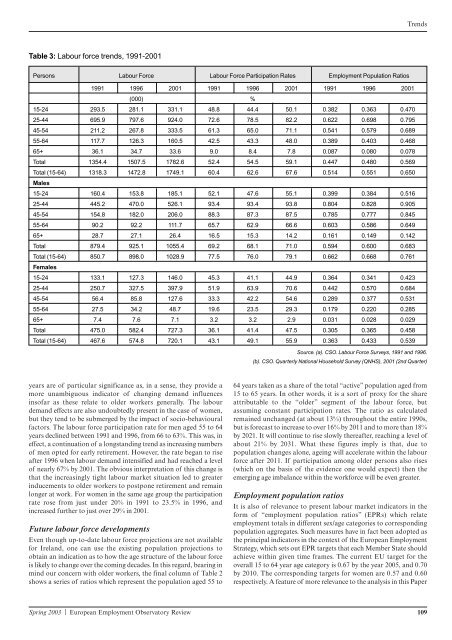
Table 3: Labour force trends, 1991-2001<br />
Persons Labour Force Labour Force Participation Rates Employment Population Ratios<br />
1991 1996 2001 1991 1996 2001 1991 1996 2001<br />
(000) %<br />
15-24 293.5 281.1 331.1 48.8 44.4 50.1 0.382 0.363 0.470<br />
25-44 695.9 797.6 924.0 72.6 78.5 82.2 0.622 0.698 0.795<br />
45-54 211.2 267.8 333.5 61.3 65.0 71.1 0.541 0.579 0.689<br />
55-64 117.7 126.3 160.5 42.5 43.3 48.0 0.389 0.403 0.468<br />
65+ 36.1 34.7 33.6 9.0 8.4 7.8 0.087 0.080 0.078<br />
Total 1354.4 1507.5 1782.6 52.4 54.5 59.1 0.447 0.480 0.569<br />
Total (15-64) 1318.3 1472.8 1749.1 60.4 62.6 67.6 0.514 0.551 0.650<br />
Males<br />
15-24 160.4 153.8 185.1 52.1 47.6 55.1 0.399 0.384 0.516<br />
25-44 445.2 470.0 526.1 93.4 93.4 93.8 0.804 0.828 0.905<br />
45-54 154.8 182.0 206.0 88.3 87.3 87.5 0.785 0.777 0.845<br />
55-64 90.2 92.2 111.7 65.7 62.9 66.6 0.603 0.586 0.649<br />
65+ 28.7 27.1 26.4 16.5 15.3 14.2 0.161 0.149 0.142<br />
Total 879.4 925.1 1055.4 69.2 68.1 71.0 0.594 0.600 0.683<br />
Total (15-64) 850.7 898.0 1028.9 77.5 76.0 79.1 0.662 0.668 0.761<br />
Females<br />
15-24 133.1 127.3 146.0 45.3 41.1 44.9 0.364 0.341 0.423<br />
25-44 250.7 327.5 397.9 51.9 63.9 70.6 0.442 0.570 0.684<br />
45-54 56.4 85.8 127.6 33.3 42.2 54.6 0.289 0.377 0.531<br />
55-64 27.5 34.2 48.7 19.6 23.5 29.3 0.179 0.220 0.285<br />
65+ 7.4 7.6 7.1 3.2 3.2 2.9 0.031 0.028 0.029<br />
Total 475.0 582.4 727.3 36.1 41.4 47.5 0.305 0.365 0.458<br />
Total (15-64) 467.6 574.8 720.1 43.1 49.1 55.9 0.363 0.433 0.539<br />
years are of particular significance as, in a sense, they provide a<br />
more unambiguous indicator of changing demand influences<br />
insofar as these relate to older workers generally. <strong>The</strong> labour<br />
demand effects are also undoubtedly present in the case of women,<br />
but they tend to be submerged by the impact of socio-behavioural<br />
factors. <strong>The</strong> labour force participation rate for men aged 55 to 64<br />
years declined between 1991 and 1996, from 66 to 63%. This was, in<br />
effect, a continuation of a longstanding trend as increasing numbers<br />
of men opted for early retirement. However, the rate began to rise<br />
after 1996 when labour demand intensified and had reached a level<br />
of nearly 67% by 2001. <strong>The</strong> obvious interpretation of this change is<br />
that the increasingly tight labour market situation led to greater<br />
inducements to older workers to postpone retirement and remain<br />
longer at work. For women in the same age group the participation<br />
rate rose from just under 20% in 1991 to 23.5% in 1996, and<br />
increased further to just over 29% in 2001.<br />
Future labour force developments<br />
Even though up-to-date labour force projections are not available<br />
for Ireland, one can use the existing population projections to<br />
obtain an indication as to how the age structure of the labour force<br />
is likely to change over the coming decades. In this regard, bearing in<br />
mind our concern with older workers, the final column of Table 2<br />
shows a series of ratios which represent the population aged 55 to<br />
Spring 2003 | European Employment Observatory Review 109<br />
Trends<br />
Source. (a). CSO. Labour Force Surveys, 1991 and 1996.<br />
(b). CSO. Quarterly National Household Survey (QNHS), 2001 (2nd Quarter)<br />
64 years taken as a share of the total “active” population aged from<br />
15 to 65 years. In other words, it is a sort of proxy for the share<br />
attributable to the “older” segment of the labour force, but<br />
assuming constant participation rates. <strong>The</strong> ratio as calculated<br />
remained unchanged (at about 13%) throughout the entire 1990s,<br />
but is forecast to increase to over 16% by 2011 and to more than 18%<br />
by 2021. It will continue to rise slowly thereafter, reaching a level of<br />
about 21% by 2031. What these figures imply is that, due to<br />
population changes alone, ageing will accelerate within the labour<br />
force after 2011. If participation among older persons also rises<br />
(which on the basis of the evidence one would expect) then the<br />
emerging age imbalance within the workforce will be even greater.<br />
Employment population ratios<br />
It is also of relevance to present labour market indicators in the<br />
form of “employment population ratios” (EPRs) which relate<br />
employment totals in different sex/age categories to corresponding<br />
population aggregates. Such measures have in fact been adopted as<br />
the principal indicators in the context of the European Employment<br />
Strategy, which sets out EPR targets that each Member State should<br />
achieve within given time frames. <strong>The</strong> current EU target for the<br />
overall 15 to 64 year age category is 0.67 by the year 2005, and 0.70<br />
by 2010. <strong>The</strong> corresponding targets for women are 0.57 and 0.60<br />
respectively. A feature of more relevance to the analysis in this Paper