FRANCE The
FRANCE The
FRANCE The

You also want an ePaper? Increase the reach of your titles
YUMPU automatically turns print PDFs into web optimized ePapers that Google loves.
Trends<br />
is the fact that there is also an EU 2010 target of 0.50 for older<br />
workers aged between 55 and 64 years.<br />
It is clear that in value or absolute terms EPRs are similar to labour<br />
force participation rates, the difference being, in effect, the<br />
unemployment component. Since unemployment among older<br />
workers is very low at present in Ireland (2.6% in 2001 as against an<br />
overall rate of 3.7%) it does not materially matter which indicator is<br />
used, especially in making cross-sectional comparisons. However, as<br />
unemployment was higher in earlier years, in considering trend<br />
analyses the EPRs tend to exhibit more variability and signal greater<br />
change.<br />
Table 3 shows relevant EPR data for Ireland covering the period<br />
from 1991-2001. <strong>The</strong> ratio for the aggregate 15 to 64 year age group<br />
was 0.65 in 2001 compared with 0.55 in 1996 and 0.51 in 1991. On<br />
this basis, given even moderate economic growth, the 2005 EU<br />
target of 0.67 should be reached. <strong>The</strong> corresponding female<br />
employment rate in 2001 was 0.54, again suggesting the likelihood<br />
that the 2005 target of 0.57 should be attained.<br />
Turning to older workers, the table shows that the EPR for the 55 to<br />
64 year age band in 2001 was 0.47, already very close to the EU 2010<br />
target of 0.50. This, again, suggests that the target in question<br />
should be reached, unless there are either substantial economic<br />
difficulties in the intervening period, or changes in the pattern of<br />
labour supply. With regard to the latter, we are referring principally<br />
to the possibility of significant inward migration (which has been<br />
high in recent years), arising from a preference on the part of<br />
employers for younger migrants rather than older workers. 2 It will<br />
also be noted (see below) that a significant proportion of those at<br />
work in Ireland in the over 55 year age category are engaged in<br />
agriculture, a sector which in terms of numbers at work has been,<br />
and still is, in long-term secular decline. This implies that if the<br />
employment population rate for this age group is to be maintained<br />
or increased, the extra employment among older workers will have<br />
to materialise in other sectors.<br />
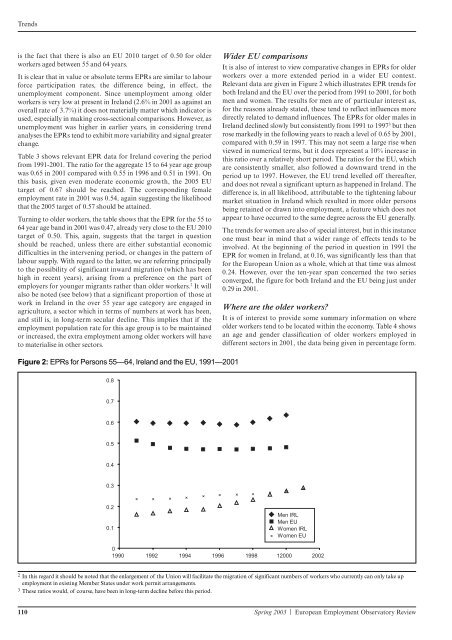
Figure 2: EPRs for Persons 55—64, Ireland and the EU, 1991—2001<br />
0.8<br />
0.7<br />
0.6<br />
0.5<br />
0.4<br />
0.3<br />
0.2<br />
0.1<br />
+<br />
+<br />
+<br />
+<br />
+<br />
Wider EU comparisons<br />
It is also of interest to view comparative changes in EPRs for older<br />
workers over a more extended period in a wider EU context.<br />
Relevant data are given in Figure 2 which illustrates EPR trends for<br />
both Ireland and the EU over the period from 1991 to 2001, for both<br />
men and women. <strong>The</strong> results for men are of particular interest as,<br />
for the reasons already stated, these tend to reflect influences more<br />
directly related to demand influences. <strong>The</strong> EPRs for older males in<br />
Ireland declined slowly but consistently from 1991 to 19973 but then<br />
rose markedly in the following years to reach a level of 0.65 by 2001,<br />
compared with 0.59 in 1997. This may not seem a large rise when<br />
viewed in numerical terms, but it does represent a 10% increase in<br />
this ratio over a relatively short period. <strong>The</strong> ratios for the EU, which<br />
are consistently smaller, also followed a downward trend in the<br />
period up to 1997. However, the EU trend levelled off thereafter,<br />
and does not reveal a significant upturn as happened in Ireland. <strong>The</strong><br />
difference is, in all likelihood, attributable to the tightening labour<br />
market situation in Ireland which resulted in more older persons<br />
being retained or drawn into employment, a feature which does not<br />
appear to have occurred to the same degree across the EU generally.<br />
<strong>The</strong> trends for women are also of special interest, but in this instance<br />
one must bear in mind that a wider range of effects tends to be<br />
involved. At the beginning of the period in question in 1991 the<br />
EPR for women in Ireland, at 0.16, was significantly less than that<br />
for the European Union as a whole, which at that time was almost<br />
0.24. However, over the ten-year span concerned the two series<br />
converged, the figure for both Ireland and the EU being just under<br />
0.29 in 2001.<br />
Where are the older workers?<br />
It is of interest to provide some summary information on where<br />
older workers tend to be located within the economy. Table 4 shows<br />
an age and gender classification of older workers employed in<br />
different sectors in 2001, the data being given in percentage form.<br />
0<br />
1990 1992 1994 1996 1998 12000 2002<br />
2 In this regard it should be noted that the enlargement of the Union will facilitate the migration of significant numbers of workers who currently can only take up<br />
employment in existing Member States under work permit arrangements.<br />
3 <strong>The</strong>se ratios would, of course, have been in long-term decline before this period.<br />
+<br />
110 Spring 2003 | European Employment Observatory Review<br />
+<br />
+<br />
+<br />
+<br />
+<br />
+<br />
Men IRL<br />
Men EU<br />
Women IRL<br />
Women EU