FRANCE The
FRANCE The
FRANCE The

Create successful ePaper yourself
Turn your PDF publications into a flip-book with our unique Google optimized e-Paper software.
Trends<br />
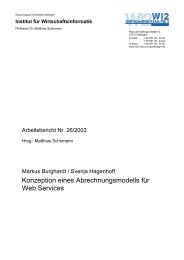
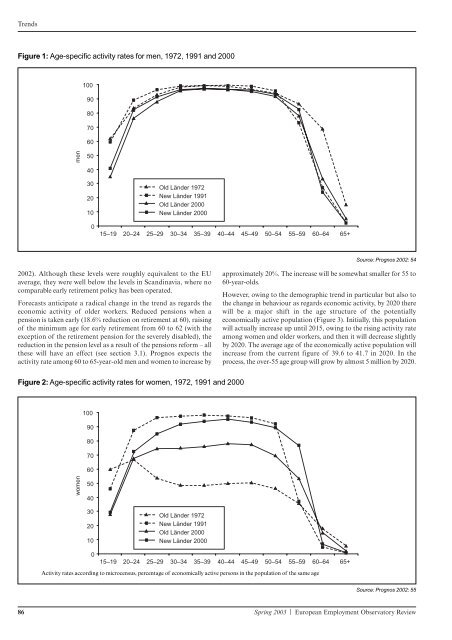
Figure 1: Age-specific activity rates for men, 1972, 1991 and 2000<br />
men<br />
100<br />
90<br />
80<br />
70<br />
60<br />
50<br />
40<br />
30<br />
20<br />
10<br />
0<br />
Old Länder 1972<br />
New Länder 1991<br />
Old Länder 2000<br />
New Länder 2000<br />
15–19 20–24 25–29 30–34 35–39 40–44 45–49 50–54 55–59 60–64 65+<br />
2002). Although these levels were roughly equivalent to the EU<br />
average, they were well below the levels in Scandinavia, where no<br />
comparable early retirement policy has been operated.<br />
Forecasts anticipate a radical change in the trend as regards the<br />
economic activity of older workers. Reduced pensions when a<br />
pension is taken early (18.6% reduction on retirement at 60), raising<br />
of the minimum age for early retirement from 60 to 62 (with the<br />
exception of the retirement pension for the severely disabled), the<br />
reduction in the pension level as a result of the pensions reform – all<br />
these will have an effect (see section 3.1). Prognos expects the<br />
activity rate among 60 to 65-year-old men and women to increase by<br />
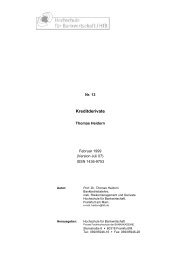
Figure 2: Age-specific activity rates for women, 1972, 1991 and 2000<br />
women<br />
100<br />
90<br />
80<br />
70<br />
60<br />
50<br />
40<br />
30<br />
20<br />
10<br />
0<br />
Old Länder 1972<br />
New Länder 1991<br />
Old Länder 2000<br />
New Länder 2000<br />
Source: Prognos 2002: 54<br />
approximately 20%. <strong>The</strong> increase will be somewhat smaller for 55 to<br />
60-year-olds.<br />
However, owing to the demographic trend in particular but also to<br />
the change in behaviour as regards economic activity, by 2020 there<br />
will be a major shift in the age structure of the potentially<br />
economically active population (Figure 3). Initially, this population<br />
will actually increase up until 2015, owing to the rising activity rate<br />
among women and older workers, and then it will decrease slightly<br />
by 2020. <strong>The</strong> average age of the economically active population will<br />
increase from the current figure of 39.6 to 41.7 in 2020. In the<br />
process, the over-55 age group will grow by almost 5 million by 2020.<br />
15–19 20–24 25–29 30–34 35–39 40–44 45–49 50–54 55–59 60–64 65+<br />
Activity rates according to microcensus, percentage of economically active persons in the population of the same age<br />
Source: Prognos 2002: 55<br />
86 Spring 2003 | European Employment Observatory Review