FRANCE The
FRANCE The
FRANCE The

Create successful ePaper yourself
Turn your PDF publications into a flip-book with our unique Google optimized e-Paper software.
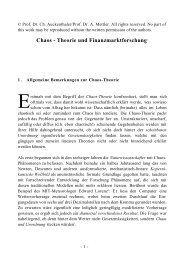
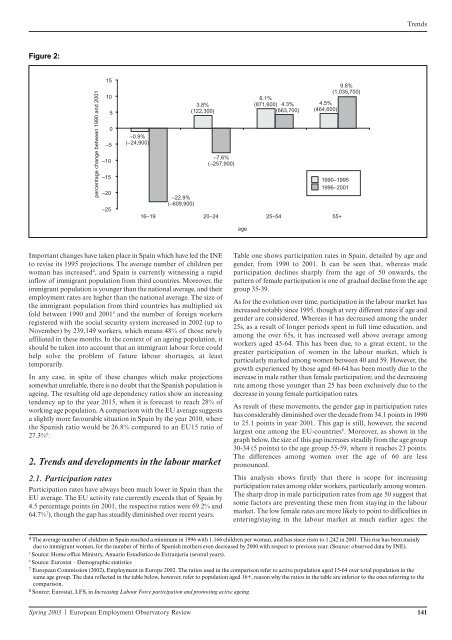
Figure 2:<br />
percentage change between 1990 and 2001<br />
15<br />
10<br />
5<br />
0<br />
–5<br />
–10<br />
–15<br />
–20<br />
–25<br />
–0.9%<br />
(–24,900)<br />
–22.9%<br />
(–609,900)<br />
3.8%<br />
(122,300)<br />
Important changes have taken place in Spain which have led the INE<br />
to revise its 1995 projections. <strong>The</strong> average number of children per<br />
woman has increased4 , and Spain is currently witnessing a rapid<br />
inflow of immigrant population from third countries. Moreover, the<br />
immigrant population is younger than the national average, and their<br />
employment rates are higher than the national average. <strong>The</strong> size of<br />
the immigrant population from third countries has multiplied six<br />
fold between 1990 and 20015 and the number of foreign workers<br />
registered with the social security system increased in 2002 (up to<br />
November) by 239,149 workers, which means 48% of those newly<br />
affiliated in these months. In the context of an ageing population, it<br />
should be taken into account that an immigrant labour force could<br />
help solve the problem of future labour shortages, at least<br />
temporarily.<br />
In any case, in spite of these changes which make projections<br />
somewhat unreliable, there is no doubt that the Spanish population is<br />
ageing. <strong>The</strong> resulting old age dependency ratios show an increasing<br />
tendency up to the year 2015, when it is forecast to reach 28% of<br />
working age population. A comparison with the EU average suggests<br />
a slightly more favourable situation in Spain by the year 2010, where<br />
the Spanish ratio would be 26.8% compared to an EU15 ratio of<br />
27.3% 6 .<br />
2. Trends and developments in the labour market<br />
–7.6%<br />
(–257,900)<br />
2.1. Participation rates<br />
Participation rates have always been much lower in Spain than the<br />
EU average. <strong>The</strong> EU activity rate currently exceeds that of Spain by<br />
4.5 percentage points (in 2001, the respective ratios were 69.2% and<br />
64.7% 7 ), though the gap has steadily diminished over recent years.<br />
6.1%<br />
(871,600) 4.3%<br />
(663,700)<br />
4.5%<br />
(464,600)<br />
16–19 20–24 25–54 55+<br />
9.8%<br />
(1,035,700)<br />
Spring 2003 | European Employment Observatory Review 141<br />
age<br />
1990–1995<br />
1996–2001<br />
Trends<br />
Table one shows participation rates in Spain, detailed by age and<br />
gender, from 1990 to 2001. It can be seen that, whereas male<br />
participation declines sharply from the age of 50 onwards, the<br />
pattern of female participation is one of gradual decline from the age<br />
group 35-39.<br />
As for the evolution over time, participation in the labour market has<br />
increased notably since 1995, though at very different rates if age and<br />
gender are considered. Whereas it has decreased among the under<br />
25s, as a result of longer periods spent in full time education, and<br />
among the over 65s, it has increased well above average among<br />
workers aged 45-64. This has been due, to a great extent, to the<br />
greater participation of women in the labour market, which is<br />
particularly marked among women between 40 and 59. However, the<br />
growth experienced by those aged 60-64 has been mostly due to the<br />
increase in male rather than female participation; and the decreasing<br />
rate among those younger than 25 has been exclusively due to the<br />
decrease in young female participation rates.<br />
As result of these movements, the gender gap in participation rates<br />
has considerably diminished over the decade from 34.1 points in 1990<br />
to 25.1 points in year 2001. This gap is still, however, the second<br />
largest one among the EU-countries8 . Moreover, as shown in the<br />
graph below, the size of this gap increases steadily from the age group<br />
30-34 (5 points) to the age group 55-59, where it reaches 23 points.<br />
<strong>The</strong> differences among women over the age of 60 are less<br />
pronounced.<br />
This analysis shows firstly that there is scope for increasing<br />
participation rates among older workers, particularly among women.<br />
<strong>The</strong> sharp drop in male participation rates from age 50 suggest that<br />
some factors are preventing these men from staying in the labour<br />
market. <strong>The</strong> low female rates are more likely to point to difficulties in<br />
entering/staying in the labour market at much earlier ages: the<br />
4 <strong>The</strong> average number of children in Spain reached a minimum in 1996 with 1.166 children per woman, and has since risen to 1.242 in 2001. This rise has been mainly<br />
due to immigrant women, for the number of births of Spanish mothers even decreased by 2000 with respect to previous year. (Source: observed data by INE).<br />
5 Source: Home office Ministry, Anuario Estadístico de Extranjería (several years).<br />
6 Source: Eurostat – Demographic statistics<br />
7 European Commission (2002), Employment in Europe 2002. <strong>The</strong> ratios used in the comparison refer to active population aged 15-64 over total population in the<br />
same age group. <strong>The</strong> data reflected in the table below, however, refer to population aged 16+, reason why the ratios in the table are inferior to the ones referring to the<br />
comparison.<br />
8 Source: Eurostat, LFS, in Increasing Labour Force participation and promoting active ageing.