FRANCE The
FRANCE The
FRANCE The

You also want an ePaper? Increase the reach of your titles
YUMPU automatically turns print PDFs into web optimized ePapers that Google loves.
Trends<br />
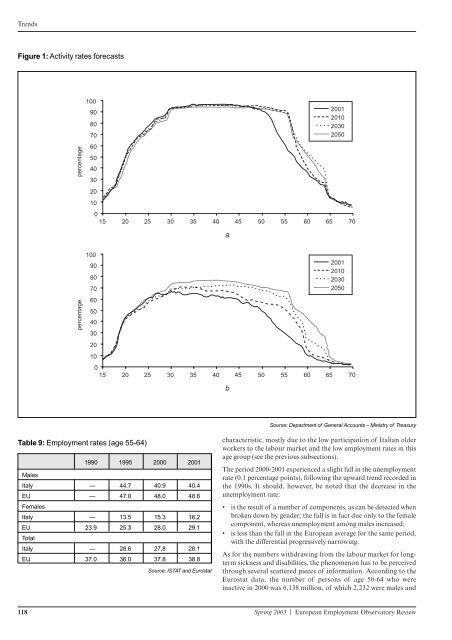
Figure 1: Activity rates forecasts<br />
percentage<br />
percentage<br />
100<br />
90<br />
80<br />
70<br />
60<br />
50<br />
40<br />
30<br />
20<br />
10<br />
100<br />
0<br />
15 20 25 30 35 40 45 50 55 60 65 70<br />
90<br />
80<br />
70<br />
60<br />
50<br />
40<br />
30<br />
20<br />
10<br />
Table 9: Employment rates (age 55-64)<br />
Males<br />
characteristic, mostly due to the low participation of Italian older<br />
workers to the labour market and the low employment rates in this<br />
age group (see the previous subsections).<br />
<strong>The</strong> period 2000-2001 experienced a slight fall in the unemployment<br />
rate (0.1 percentage points), following the upward trend recorded in<br />
the 1990s. It should, however, be noted that the decrease in the<br />
unemployment rate:<br />
• is the result of a number of components, as can be detected when<br />
broken down by gender; the fall is in fact due only to the female<br />
component, whereas unemployment among males increased;<br />
• is less than the fall in the European average for the same period,<br />
with the differential progressively narrowing.<br />
As for the numbers withdrawing from the labour market for longterm<br />
sickness and disabilities, the phenomenon has to be perceived<br />
through several scattered pieces of information. According to the<br />
Eurostat data, the number of persons of age 50-64 who were<br />
inactive in 2000 was 6,138 million, of which 2,232 were males and<br />
118 Spring 2003 | European Employment Observatory Review<br />
a<br />
2001<br />
2010<br />
2030<br />
2050<br />
0<br />
15 20 25 30 35 40 45 50 55 60 65 70<br />
1990 1995 2000 2001<br />
Italy — 44.7 40.9 40.4<br />
EU — 47.0 48.0 48.6<br />
Females<br />
Italy — 13.5 15.3 16,2<br />
EU 23.9 25.3 28.0 29.1<br />
Total<br />
Italy — 28.6 27,8 28.1<br />
EU 37.0 36.0 37.8 38.8<br />
Source: ISTAT and Eurostat<br />
b<br />
2001<br />
2010<br />
2030<br />
2050<br />
Source: Department of General Accounts – Ministry of Treasury