FRANCE The
FRANCE The
FRANCE The

Create successful ePaper yourself
Turn your PDF publications into a flip-book with our unique Google optimized e-Paper software.
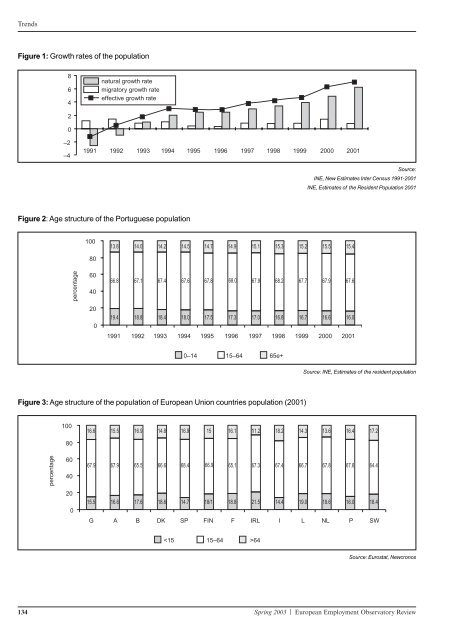
Trends<br />
Figure 1: Growth rates of the population<br />
8<br />
6<br />
4<br />
2<br />
0<br />
–2<br />
–4<br />
natural growth rate<br />
migratory growth rate<br />
effective growth rate<br />
1991 1992 1993 1994 1995 1996 1997 1998 1999 2000 2001<br />
Figure 2: Age structure of the Portuguese population<br />
percentage<br />
100<br />
80<br />
60<br />
40<br />
20<br />
0<br />
13.8 14.0 14.2 14.5 14.7 14.9 15.1 15.3 15.2 15.5 15.4<br />
66.8 67.1 67.4 67.6 67.8 68.0 67.9 68.2 67.7 67.9 67.6<br />
19.4 18.8 18.4 18.0 17.5 17.3 17.0 16.8 16.7 16.6 16.0<br />
1991 1992 1993 1994 1995 1996 1997 1998 1999 2000 2001<br />
0–14 15–64 65e+<br />
Figure 3: Age structure of the population of European Union countries population (2001)<br />
percentage<br />
100<br />
80<br />
60<br />
40<br />
20<br />
0<br />
16.6 15.5 16.9 14.8 16.9 15 16.1 11.2 18.2 14.3 13.6<br />
67.9 67.9 65.5 66.6 68.4 66.9 65.1 67.3 67.4 66.7 67.8<br />
15.5 16.6 17.6 18.6 14.7 18/1 18.8 21.5 14.4 19.0 18.6<br />
G A B DK SP FIN F IRL I L NL<br />
64<br />
Source:<br />
INE, New Estimates Inter Census 1991-2001<br />
INE, Estimates of the Resident Population 2001<br />
Source: INE, Estimates of the resident population<br />
134 Spring 2003 | European Employment Observatory Review<br />
16.4<br />
67.6<br />
16.0<br />
17.2<br />
64.4<br />
18.4<br />
P SW<br />
Source: Eurostat, Newcronos