FRANCE The
FRANCE The
FRANCE The

Create successful ePaper yourself
Turn your PDF publications into a flip-book with our unique Google optimized e-Paper software.
Trends<br />
Table 2<br />
Total unemployment rate — age:15 years and over<br />
1990 1995 2000 2001<br />
EU-15 : 10.7 8.4 7.3<br />
NL 7.7 7.2 2.7 2.1<br />
Unemployment rate — Women, age:15 years and over<br />
1990 1995 2000 2001<br />
EU-15 : 12.4 9.9 8.5<br />
NL 10.9 8.7 3.5 2.5<br />
Total unemployment rate — age:55-64<br />
1990 1995 2000 2001<br />
EU-15 : 8.3 7.6 6.5<br />
NL 3.8 3.5 1.9 1.5<br />
Unemployment rate — Women, age:55-64<br />
1990 1995 2000 2001<br />
EU-15 : 8 7.8 29.1<br />
LU : : : :<br />
NL 6.3 3.2 2.1 1.1<br />
Table 3: Life-long learning<br />
Source: Eurostat, Labour Force Survey<br />
Percentage of the population aged 25-64,55-64 participating<br />
in education and training over the four weeks prior to the survey<br />
1992 1995 2000 2001<br />
Aged 25-64 55-64 25-64 55-64 25-64 55-64 25-64 55-64<br />
EU-15 : : : : 8.5 3 8.4 3<br />
NL 15.1 4.9 13.1 4.2 15.6 6.4 16.3 6.5<br />
Table 4: Educational Attainment<br />
Source: Eurostat, Labour Force Survey<br />
Percentage of the population aged 25-64, 55-64 having achieved<br />
at least upper secondary education<br />
1992 1995 2000 2001<br />
Aged 25-64 55-64 25-64 55-64 25-64 55-64 25-64 55-64<br />
EU-15 : : 55.4 38.6 63.5 48.4 63.8 48.4<br />
NL : : : : 66.1 53.5 66.9 52.5<br />
Source: Eurostat, Labour Force Survey<br />
3 Statistics Netherland, Foreigners in the Netherlands (Allochtonen in Nederland), 2002.<br />
4 Employment rate scenarios up to 2005 and 2010.<br />
future generations of older people will display higher participation<br />
rates. Furthermore, the ageing of the population is slowed down by<br />
the strong growth of the non-western nationals’ population<br />
(currently 10% of the population). On average, non-western<br />
nationals have more children than the native population and tend to<br />
come to the Netherlands at a relatively young age. 3<br />
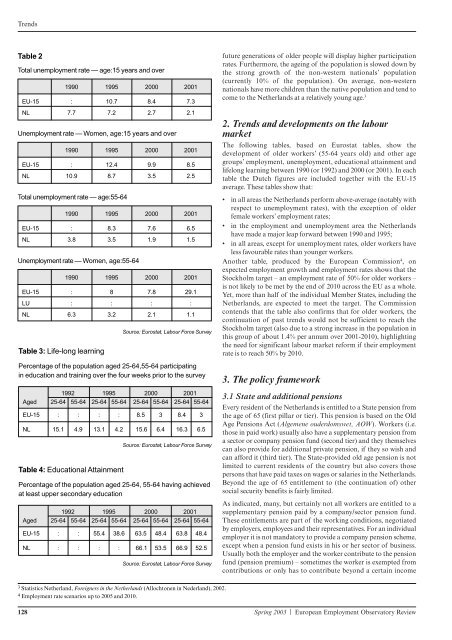
2. Trends and developments on the labour<br />
market<br />
<strong>The</strong> following tables, based on Eurostat tables, show the<br />
development of older workers’ (55-64 years old) and other age<br />
groups’ employment, unemployment, educational attainment and<br />
lifelong learning between 1990 (or 1992) and 2000 (or 2001). In each<br />
table the Dutch figures are included together with the EU-15<br />
average. <strong>The</strong>se tables show that:<br />
• in all areas the Netherlands perform above-average (notably with<br />
respect to unemployment rates), with the exception of older<br />
female workers’ employment rates;<br />
• in the employment and unemployment area the Netherlands<br />
have made a major leap forward between 1990 and 1995;<br />
• in all areas, except for unemployment rates, older workers have<br />
less favourable rates than younger workers.<br />
Another table, produced by the European Commission 4 , on<br />
expected employment growth and employment rates shows that the<br />
Stockholm target – an employment rate of 50% for older workers –<br />
is not likely to be met by the end of 2010 across the EU as a whole.<br />
Yet, more than half of the individual Member States, including the<br />
Netherlands, are expected to meet the target. <strong>The</strong> Commission<br />
contends that the table also confirms that for older workers, the<br />
continuation of past trends would not be sufficient to reach the<br />
Stockholm target (also due to a strong increase in the population in<br />
this group of about 1.4% per annum over 2001-2010), highlighting<br />
the need for significant labour market reform if their employment<br />
rate is to reach 50% by 2010.<br />
3. <strong>The</strong> policy framework<br />
3.1 State and additional pensions<br />
Every resident of the Netherlands is entitled to a State pension from<br />
the age of 65 (first pillar or tier). This pension is based on the Old<br />
Age Pensions Act (Algemene ouderdomswet, AOW). Workers (i.e.<br />
those in paid work) usually also have a supplementary pension from<br />
a sector or company pension fund (second tier) and they themselves<br />
can also provide for additional private pension, if they so wish and<br />
can afford it (third tier). <strong>The</strong> State-provided old age pension is not<br />
limited to current residents of the country but also covers those<br />
persons that have paid taxes on wages or salaries in the Netherlands.<br />
Beyond the age of 65 entitlement to (the continuation of) other<br />
social security benefits is fairly limited.<br />
As indicated, many, but certainly not all workers are entitled to a<br />
supplementary pension paid by a company/sector pension fund.<br />
<strong>The</strong>se entitlements are part of the working conditions, negotiated<br />
by employers, employees and their representatives. For an individual<br />
employer it is not mandatory to provide a company pension scheme,<br />
except when a pension fund exists in his or her sector of business.<br />
Usually both the employer and the worker contribute to the pension<br />
fund (pension premium) – sometimes the worker is exempted from<br />
contributions or only has to contribute beyond a certain income<br />
128 Spring 2003 | European Employment Observatory Review