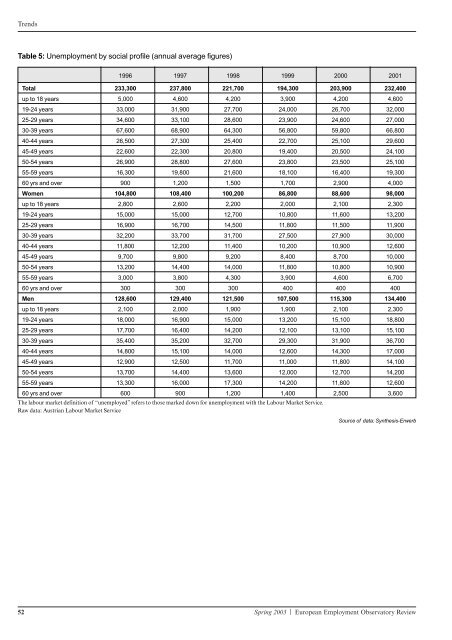
Trends Table 5: Unemployment by social profile (annual average figures) 1996 1997 1998 1999 2000 2001 Total 233,300 237,800 221,700 194,300 203,900 232,400 up to 18 years 5,000 4,600 4,200 3,900 4,200 4,600 19-24 years 33,000 31,900 27,700 24,000 26,700 32,000 25-29 years 34,600 33,100 28,600 23,900 24,600 27,000 30-39 years 67,600 68,900 64,300 56,800 59,800 66,800 40-44 years 26,500 27,300 25,400 22,700 25,100 29,600 45-49 years 22,600 22,300 20,800 19,400 20,500 24,100 50-54 years 26,900 28,800 27,600 23,800 23,500 25,100 55-59 years 16,300 19,800 21,600 18,100 16,400 19,300 60 yrs and over 900 1,200 1,500 1,700 2,900 4,000 Women 104,800 108,400 100,200 86,800 88,600 98,000 up to 18 years 2,800 2,600 2,200 2,000 2,100 2,300 19-24 years 15,000 15,000 12,700 10,800 11,600 13,200 25-29 years 16,900 16,700 14,500 11,800 11,500 11,900 30-39 years 32,200 33,700 31,700 27,500 27,900 30,000 40-44 years 11,800 12,200 11,400 10,200 10,900 12,600 45-49 years 9,700 9,800 9,200 8,400 8,700 10,000 50-54 years 13,200 14,400 14,000 11,800 10,800 10,900 55-59 years 3,000 3,800 4,300 3,900 4,600 6,700 60 yrs and over 300 300 300 400 400 400 Men 128,600 129,400 121,500 107,500 115,300 134,400 up to 18 years 2,100 2,000 1,900 1,900 2,100 2,300 19-24 years 18,000 16,900 15,000 13,200 15,100 18,800 25-29 years 17,700 16,400 14,200 12,100 13,100 15,100 30-39 years 35,400 35,200 32,700 29,300 31,900 36,700 40-44 years 14,800 15,100 14,000 12,600 14,300 17,000 45-49 years 12,900 12,500 11,700 11,000 11,800 14,100 50-54 years 13,700 14,400 13,600 12,000 12,700 14,200 55-59 years 13,300 16,000 17,300 14,200 11,800 12,600 60 yrs and over 600 900 1,200 1,400 2,500 3,600 <strong>The</strong> labour market definition of “unemployed” refers to those marked down for unemployment with the Labour Market Service. Raw data: Austrian Labour Market Service Source of data: Synthesis-Erwerb 52 Spring 2003 | European Employment Observatory Review
Table 6: Length of unemployment by social profile. Number of severances by length of unemployment in 2001 Number of severances Length of period of unemployment Table 7: Employment by social profile (annual average figures) longer than 12 months 6 to 12 months 3 to 6 months less than 3 months Total 749,200 2.4% 8.8% 22.6% 66.2% 45-49 years 88,300 2.2% 10.4% 24.6% 62.8% 50-54 years 69,900 2.4% 11.1% 25.6% 60.8% 55-59 years 95,200 7.4% 16.9% 24.7% 51.0% Women 321,700 2.5% 10.5% 22.4% 64.6% 45-49 years 38,100 2.4% 12.1% 24.0% 61.4% 50-54 years 30,100 2.3% 12.3% 24.9% 60.4% 55-59 years 37,800 8.7% 18.7% 23.8% 48.8% Men 427,500 2.4% 7.5% 22.7% 67.4% 45-49 years 50,200 2.1% 9.1% 25.1% 63.7% 50-54 years 39,900 2.5% 10.2% 26.2% 61.0% 55-59 years 57,400 6.6% 15.6% 25.4% 52.4% Raw data: Austrian Labour Market Service Source of data: Synthesis-Erwerb 1997 1998 1999 2000 2001 2002 Total 2,968,500 2,998,300 3,035,500 3,064,500 3,078,100 3,063,500 up to 18 years 119,900 124,100 123,600 121,400 118,000 113,700 19-24 years 347,300 339,800 343,800 331,000 327,200 320,100 25-29 years 419,100 393,500 394,400 381,600 363,700 339,200 30-39 years 918,200 935,300 956,000 972,500 964,400 931,300 40-44 years 384,600 403,100 413,900 435,900 451,600 465,000 45-49 years 336,000 339,100 337,900 347,500 364,100 380,700 50-54 years 264,900 275,200 275,800 295,500 304,500 305,000 55-59 years 155,800 163,800 160,700 150,600 152,700 170,600 60 yrs and over 22,800 24,300 29,500 28,500 32,000 37,800 Women 1,241,500 1,266,000 1,292,900 1,319,700 1,342,900 1,345,100 up to 18 years 46,300 48,900 48,000 47,000 45,800 44,400 19-24 years 168,900 164,500 166,600 155,300 153,500 150,100 25-29 years 179,800 166,700 177,900 175,100 168,200 154,200 30-39 years 371,600 382,800 399,900 415,400 418,500 405,200 40-44 years 168,200 180,000 181,800 194,200 203,300 211,500 45-49 years 145,500 150,600 148,200 156,000 166,400 177,100 50-54 years 111,700 119,100 117,300 126,700 132,900 137,100 55-59 years 42,100 45,900 44,900 41,800 45,600 55,800 60 yrs and over 7,300 7,500 8,300 8,300 8,800 9,700 Men 1,727,000 1,732,300 1,742,600 1,744,700 1,735,200 1,718,400 up to 18 years 73,600 75,200 75,600 74,400 72,300 69,300 19-24 years 178,400 175,300 177,200 175,700 173,700 170,000 25-29 years 239,200 226,800 216,500 206,500 195,500 185,000 30-39 years 546,600 552,500 556,100 557,100 545,900 526,100 40-44 years 216,400 223,100 232,100 241,700 248,300 253,600 45-49 years 190,500 188,500 189,700 191,600 197,700 203,600 50-54 years 153,100 156,100 158,400 168,800 171,600 167,900 55-59 years 113,600 117,900 115,800 108,700 107,100 114,800 60 yrs and over 15,500 16,800 21,200 20,200 23,200 28,100 Employment with full insurance contributions (incl. Zivildienst and measures under the Labour Market Policy Financing Law [AMSG]). Raw data: Hauptverband der Österreichischen Sozialversicherungsträger Source of data: Synthesis-Erwerb Spring 2003 | European Employment Observatory Review 53 Trends
- Page 1 and 2: Employment & European Social Fund E
- Page 3 and 4: European Employment Observatory Rev
- Page 5 and 6: Table of Contents Policies Overall
- Page 7 and 8: AUSTRIA The programme of the Austri
- Page 9 and 10: FINLAND Essential changes to legisl
- Page 11 and 12: At least one quarter of the members
- Page 13 and 14: in the event of a third and subsequ
- Page 15 and 16: of active labour-market policy, as
- Page 17 and 18: Training Networks Programme The Tra
- Page 19 and 20: Subsequently, the provisions concer
- Page 21 and 22: a strengthening and revitalisation
- Page 23 and 24: workers into the labour market as w
- Page 25 and 26: This reinforced targeting and resul
- Page 27 and 28: BELGIUM The Occupational Immersion
- Page 29 and 30: Agreement on converting 10,000 subs
- Page 31 and 32: outplacement procedure, its duratio
- Page 33 and 34: Integration agreements Another impo
- Page 35 and 36: and local job and volunteering oppo
- Page 37 and 38: FINLAND Preliminary information on
- Page 39 and 40: BELGIUM Harmonisation and simplific
- Page 41 and 42: • Returning migrants Eligibility
- Page 43 and 44: Playing the generation game: an ove
- Page 45 and 46: workers, who have either exited the
- Page 47 and 48: e) Finland’s comprehensive approa
- Page 49 and 50: Compared with the figures for 1997,
- Page 51: Table 4: Activity quotas by age and
- Page 55 and 56: 4Prospects In view of the demograph
- Page 57 and 58: and is exempted from the obligation
- Page 59 and 60: The Government is also addressing t
- Page 61 and 62: permanente, 97-124 Desmet, R. and J
- Page 63 and 64: Table 4: Breakdown by age of older
- Page 65 and 66: Figure 1: Gender gap in the activit
- Page 67 and 68: Figure 5: Effective and statutory r
- Page 69 and 70: 3. Recent trends in policies As alr
- Page 71 and 72: 3.3 Labour market programmes for el
- Page 73 and 74: Figure 1: Population aged 15 and ov
- Page 75 and 76: Table 3: Labour market transition r
- Page 77 and 78: companies. One of these projects wa
- Page 79 and 80: Table 2: Projection of the economic
- Page 81 and 82: Table 8: Numbers entering Early Ret
- Page 83 and 84: Figure 1: Rate of access to trainin
- Page 85 and 86: Germany 1 Introduction As far back
- Page 87 and 88: Figure 3: Potentially economically
- Page 89 and 90: Figure 5: Take-up of early-retireme
- Page 91 and 92: Figure 8: Average amounts paid unde
- Page 93 and 94: 64.5% (Hain/Tautz 2001: 365) withou
- Page 95 and 96: Table 6: Collectively agreed workin
- Page 97 and 98: Strukturbruch und Arbeitsmark-tentw
- Page 99 and 100: men (Figure 3). In clear contrast w
- Page 101 and 102: Figure 5: Unemployment rates, males
- Page 103 and 104:
More recent data, provided by Euros
- Page 105 and 106:
pensions retracted to normal levels
- Page 107 and 108:
Ireland 1. Introduction This Paper
- Page 109 and 110:
Table 3: Labour force trends, 1991-
- Page 111 and 112:
Table 4: Employment by age across s
- Page 113 and 114:
Occupational pensions There are als
- Page 115 and 116:
Italy 1. Introduction The EU offici
- Page 117 and 118:
Table 7: Activity rates (age 55-64)
- Page 119 and 120:
Table 10: Forecasts of employment r
- Page 121 and 122:
should take the territorial imbalan
- Page 123 and 124:
2. Statistical Data 5 Number of pen
- Page 125 and 126:
4.2 Measures to encourage older wor
- Page 127 and 128:
6. Conclusions With regard to keepi
- Page 129 and 130:
level. No taxes and social premiums
- Page 131 and 132:
edundancy scheme by employers. The
- Page 133 and 134:
uittreding: early retirement) schem
- Page 135 and 136:
Figure 4: Dependency and ageing ind
- Page 137 and 138:
Figure 8: Percentage of working age
- Page 139 and 140:
Figure 11: Average age of workers l
- Page 141 and 142:
Figure 2: percentage change between
- Page 143 and 144:
Figure 4: Figure 5: 25 20 15 10 0 -
- Page 145 and 146:
100 90 80 70 60 50 40 30 20 10 Figu
- Page 147 and 148:
However, this measure does not cove
- Page 149 and 150:
Table 1(a): Employment rate, men, 5
- Page 151 and 152:
Figure 3(b): Main Source of income
- Page 153 and 154:
4. Policies to stimulate active age
- Page 155 and 156:
Appendix Table A1(a): Participation
- Page 157 and 158:
Venta • Salg • Verkauf • Pvl